Predictive Analytics for the Masses with Power BI and Office 365
Power BI is Microsoft’s cloud based service that leverages Excel to enable self-service business intelligence. The term Power BI has also been used generically to reference the components and technologies that compromise the Microsoft BI suite of tools. Specifically, PowerPivot, PowerView, PowerQuery, PowerMaps, Question & Answer (Q&A) and now Forecasting. The Q&A and Forecasting features are currently supported only in Office 365 and SharePoint on-line. The other features are fully supported in the desktop (Office Professional Plus) and Office 365 versions of Excel 2013.
The latest incarnation of Office 365 implements time series analysis to provide forecasting capabilities. It is this version and its forecasting capabilities that will be discussed in this article. The description and definition of the specific time series algorithms related to forecasting is beyond the scope of this discussion but, the implications of providing this capability are not.
The methods and techniques for time series analysis are well documented and understood in academia and in the field of statistics, but now this capability is being placed in the hands of the masses that may or may not have a thorough understanding of the associated techniques or how to interpret the results. This may present a change management issue for an organization, but with some planning a great deal of benefits and insights can be obtained that would otherwise not be realized.
From a change management perspective, it is imperative that a consistent approach be defined and implemented to ensure consistent results when developing an analytics solution. This should also include a training program on terminology, techniques, methods and practices.
Let’s take a detailed look at the process that will lead to obtaining useful insights from a forecasting exercise and then how this process applies to an example implemented in Power BI.
Process Flow
- Business Understanding – Understanding from a business perspective of the project objectives, requirements and what the specific outcomes should be. This may also include an initial reference to an analytic methodology or approach (forecasting, classification, etc.).
- Data Understanding – Understanding of the traits/personality (profile) of the data. Are there data quality issues? What are the valid domains of attribute values? Are there obvious patterns?
- Data Preparation – Does the data need to be reformatted? How will missing values be handled? What are the relevant attributes or subsets of data?
- Modeling – Identify potential modeling techniques to meet the requirements of the business solutions and its objectives.
- Evaluation – Evaluate the model and determine its fitness for use. How accurate is the model? Does it address the business requirements? Have new insights been exposed that change the understanding of the data?
- Deployment – Present the model results. Make sure the appropriate visualization is used to present the results. Does the deployment require a simple report, or is a new process required to close the analytic loop?
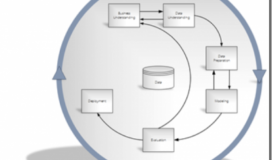
This process is depicted in the following diagram:
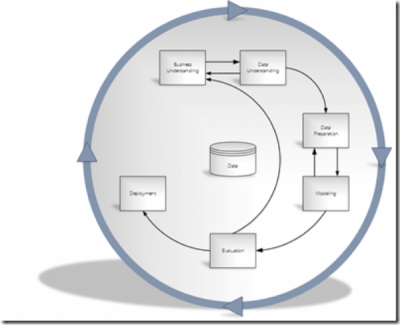
The above process steps define the CRISPtm data mining methodology which provides an excellent foundational approach and process for development and deployment of predictive analytic and data mining solutions. It has been around for some time, but the basic tenets are very applicable. Let’s now look at an example of how Power BI forecasting can be leveraged and how the process steps are implemented.
Example
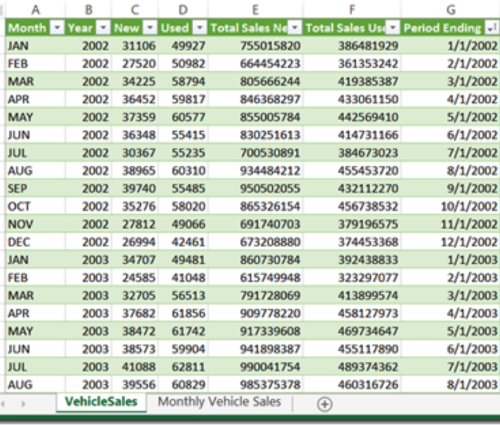
The following data represents new and used car sales from 2002-2014. The data is stored by month. Examining the raw data, this is the opportune moment to address business understanding and identification of the business problem and requirements. In this case the business problem is to forecast future new car sales to help better manage inventory. Also, understanding the nature and characteristics of the data should be accomplished at this point. This can be done via data profiling (min, max, null counts, standard deviation, etc.) and through data visualization. It would also help to have a domain expert available to provide additional insights. With regards to data preparation for Power BI Forecasting, there should be an attribute that can be used for time series analysis. In this case, a new attribute is created named [Period Ending] that is a combination of the [Year] and the [Month] represented internally as a date.
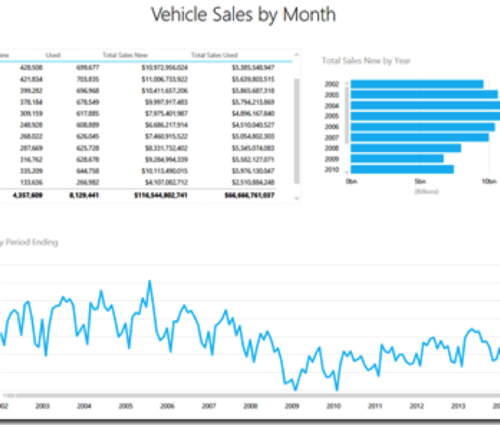
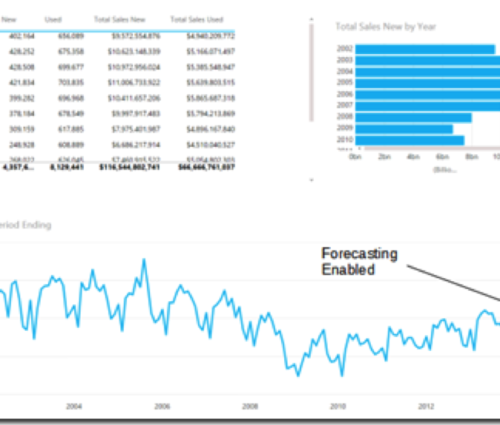
The above data was loaded into a PowerPivot workbook and uploaded to Power BI where some visualizations were applied. The line chart shows new car sales units over time. This line chart will be our candidate for time series analysis (forecasting). Note that there appears to be a cyclical pattern in the data. This is a good reason to generate a visualization to provide insights into the nature of the data.
Currently, to perform forecasting, Power BI must be placed in HTML5 mode. This is accomplished via an icon in the lower right corner of the web page. Once that has been done, then hovering over the chart will expose a caret that indicates forecasting may be performed.
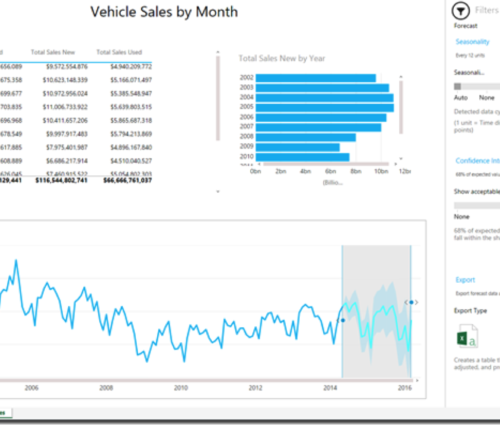
Clicking the caret produces a forecast and displays an additional panel that contains adjustable sliders for confidence interval and seasonality. The forecasting algorithm will attempt to detect seasonality and display the calculated cycle in terms of units. The seasonality slider allows for manually setting the number of periods over which cycles will repeat. For example, if based on domain knowledge, it is known that the seasonality is different from what is calculated then it can be adjusted accordingly. This may change the forecasted values. In this case, the seasonality is detected to be 12 units (1 year).

The confidence interval slider displays a shaded area that indicates the number of forecasted values that fall within a specified number of standard deviations. If there is a need to have a very high correlation for forecasts, select one standard deviation. This will also be an indication of how well the forecast model fits the data. The nature and requirements of the business problem and the user will determine an acceptable value for the confidence interval. For this data, 68% of expected values fall within one standard deviation.
There is also the ability to perform a hindcast. A hindcast produces a model that uses historical data to predict future values based on a preceding selected point in time. New predictions are generated that show how the current predictions would look if the prediction was generation at some past point in time.
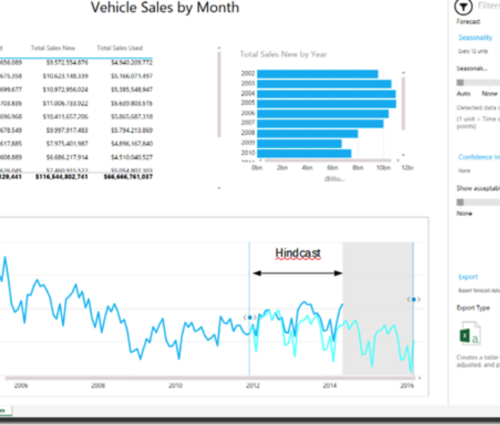
Prior to this point, the appropriate model would have been selected (time series) and the model applied and evaluated. Within Power BI, the option to select a specific time series model is not available. With regards to model evaluation, adjustment of the confidence interval and hindcasting provides the ability to evaluate the overall fitness of the model.
Finally, the model is deployed and can be used for revaluation. This can be done via exporting the model along with its data to Excel and running it back through the forecasting model again.
It has been demonstrated how Power BI forecasting can be leveraged using the CRISPtm methodology and how advanced analytics can be placed in the hands of the masses. Power BI as a solution is simple to understand, uses existing technologies and is straightforward to implement. Over time, more and more advanced analytic capabilities will be exposed to the masses and to be successful, a well defined process, approach and appropriate training must be used to ensure that proper results and insights are obtained.
Questions and comments can be addressed directly to:
Ray Johnson
Director, Data Management – Strategist
rjohnson@spr.com
http://linkedin.com/in/rayjay