
DATA FOR EVERYTHING
Visualize any data. Even your beer's.
Not even kidding. We built a dashboard to keep tabs on the type, temperature and amount of beer in our office kegerator. We clearly see trends around what beer people prefer and when they hit the keg most (tax season, anyone?) – all of it making it easier for us to plan refills.CONSTRUCTION & MANUFACTURING
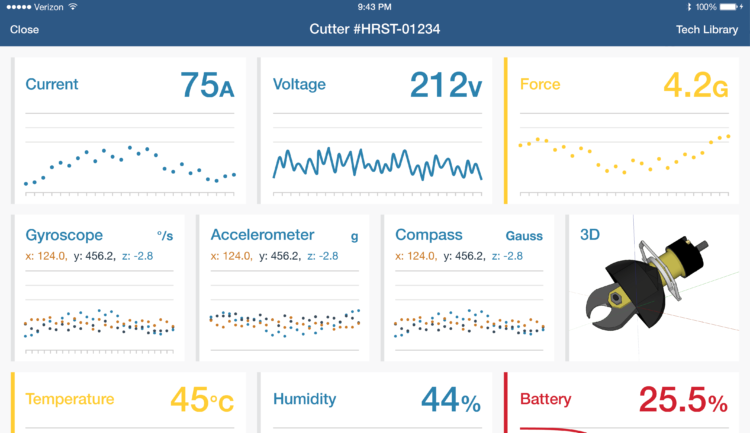
See trends around equipment and tools failure, so you can provide replacements or preventative maintenance.
Data on your equipment usage is updated in real-time so you can view performance metrics and identify when tools or equipment need to be serviced or replaced. Data is consolidated in one spot with functional charts and graphs.
LOGISTICS & SUPPLY CHAIN
Track orders, monitor shipments, and analyze the demand for products in one place.
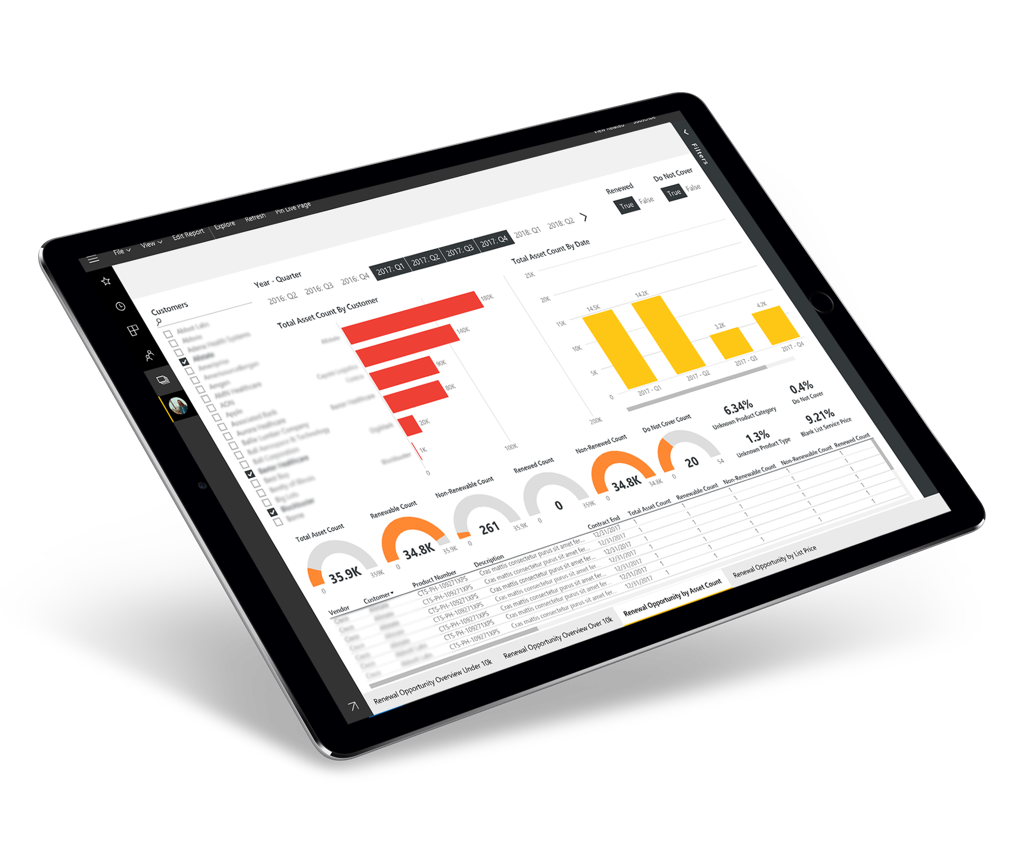
See supplier and distributor data to identify weak links in the supply chain, anticipate when to stock more product, and detect what inventory isn’t meeting forecasted demand.MARKETING & SALES
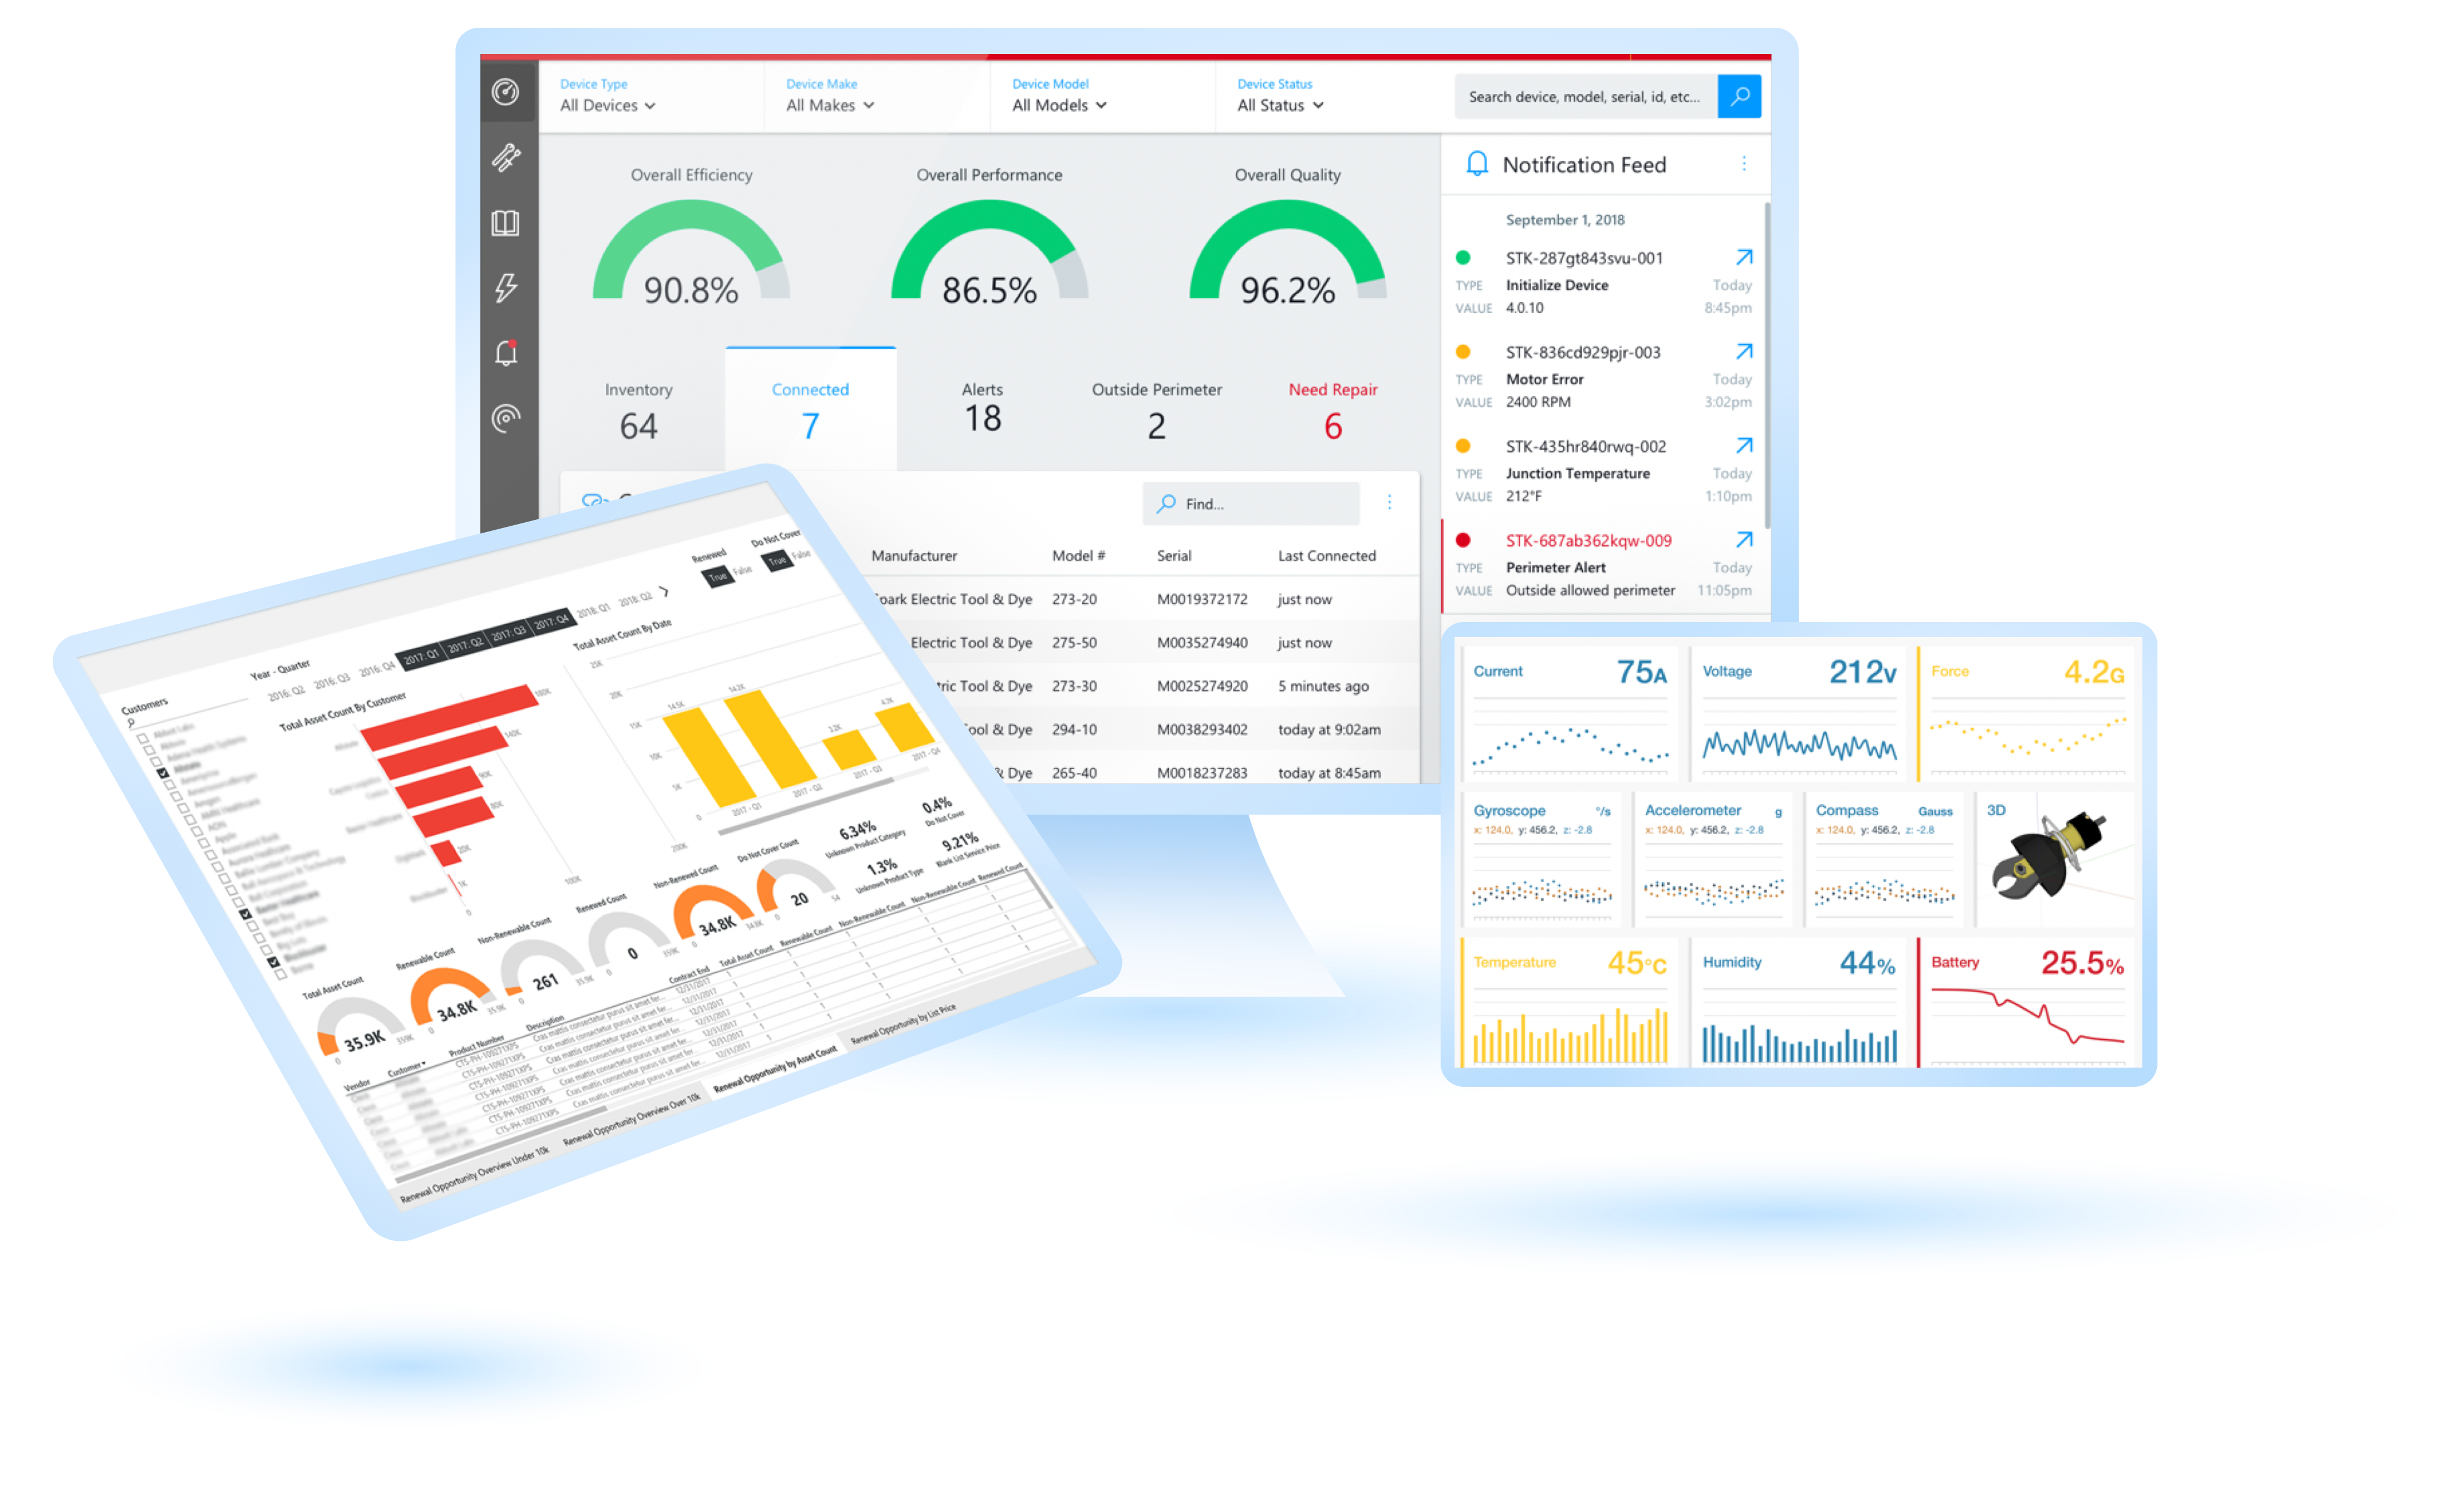
Streamline data from multiple sources so your insights are displayed in intuitive, bite-sized features.
A modern dashboard highlights content and condenses marketing & sales activity into bite-sized information. Plus, interactive elements let users adjust the data to see alternate options and recommendations for action.