Power BI Quick Tips: Associative Filtering
One of the great features of Power BI is associative filtering. This means that when a value is selected in a slicer, all associated elements on the page are automatically filtered. With the latest update to Power BI, slicers can be individually tied to specific objects on the Power BI canvas which adds another level of usability, however, sometimes the desired behavior is not observed. For example, a slicer is selected and only some of the elements are updated. In most cases, this can be traced back to the underlying design of the data model. Also, it most often occurs when analysis is being performed across multiple facts (e.g. sales. orders, inventory, etc.)
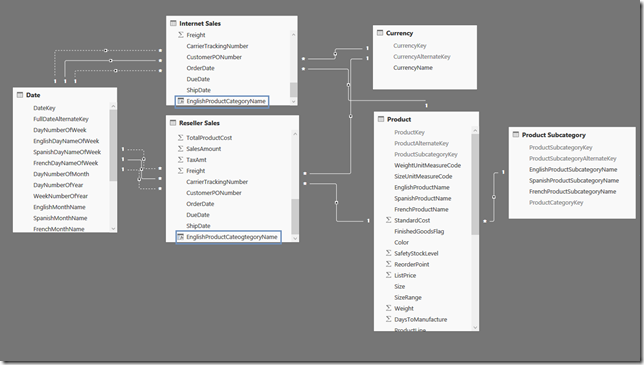
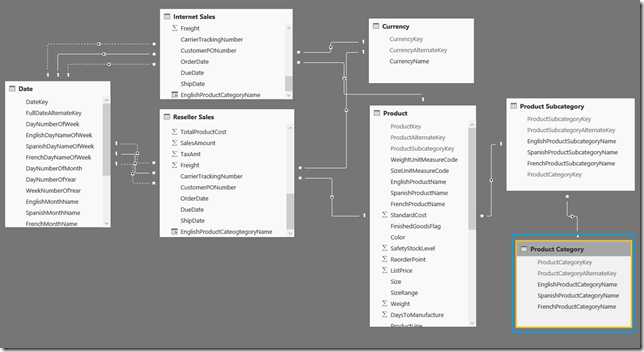
So, how does the problem of inconsistent filtering arise and how can it be avoided. To demonstrate the issue and a potential resolution, we will use our old friend AdventureWorksDW. Below is the model that will be used for illustration.
Keep in mind that AdventureWorksDW is a highly cleaned and de-normalized data source that does not reflect the typical heterogeneous sources comprised of spreadsheets, databases, flat files, etc., where there can be duplicate attributes with different semantic meanings and inconsistent data types.
With regards to the above data model, there are a few things that should be pointed out
- Two facts are being used: [Reseller Sales] and [Internet Sales].
- [EnglishProductCategoryName] (this will be used for our slicer) exists in [Reseller Sales] and [Internet Sales]
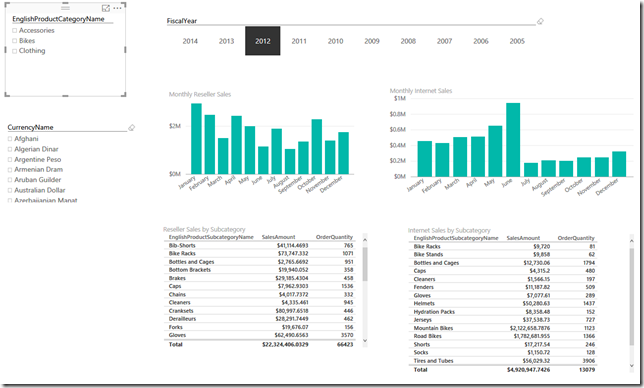
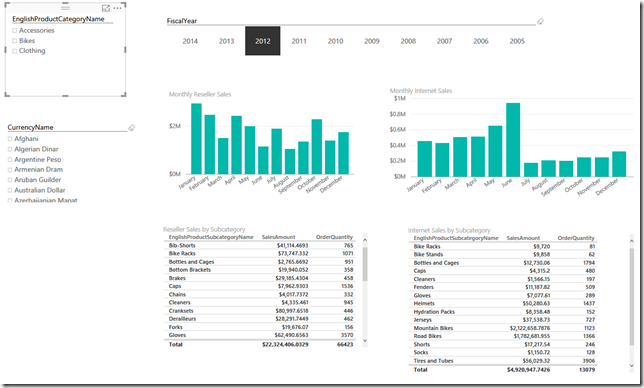
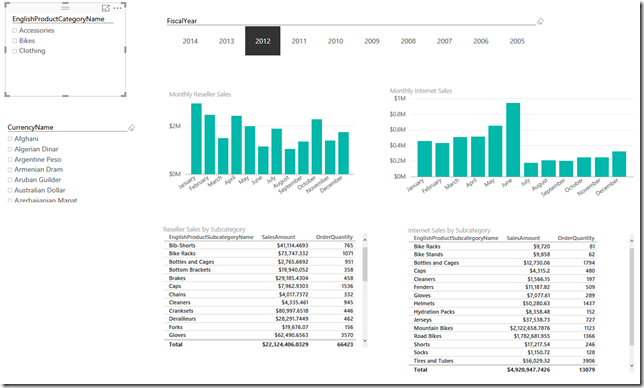
The Power BI visualization contains 2 visualizations and slicers for [FiscalYear], [CurrencyName] and [EnglishProductCategoryName] taken from the [Internet Sales] entity.
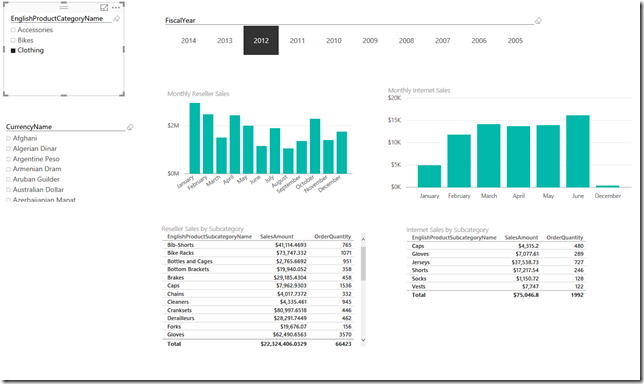
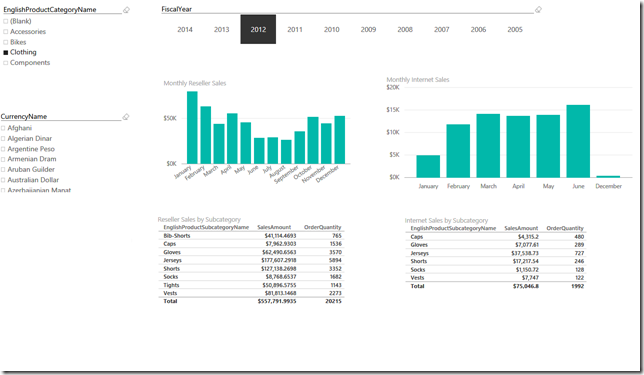
Let’s select [Clothing] in the [EnglishProductCategoryName] slicer and see what happens.
Only one set of the visualizations changed. Even though [EnglishProductCategoryName] exists in both fact tables, only the Internet Sales visualizations were affected because [EnglishProductCategoryName] is only associated with Internet Sales.
This example may be somewhat contrived, but it was designed to illustrate that some additional work may be required other than simply importing data and trying to produce some visualizations. In fact, it stresses the importance of taking the time to develop a proper data model. A good data model becomes even more important as the relationships among tables become more complex.
Here is a model that has been designed to achieve the desired results:
In this model, [Product Category] has been explicitly defined as a separate entity and connected to both [Reseller Sales] and [Internet Sales]. The new visualization uses [EnglishProductCategoryName] from the [Product Category] entity. In this instance the visualization behaves as expected because [Product Category] and its associated attributes are associated with [Reseller Sales] and [Internet Sales]. Also, the slicer contains more values that accurately portray the mix of product sales across reseller and internet sales.
So, if you encounter an instance where slicers are not behaving as expected, take a quick look at the data model, keeping in mind that a good data model can save a lot of downstream frustration. That being said; there may be occasions where filters should be selectively applied and as mentioned earlier, the latest version of Power BI provides this capability and more, which will be covered in future Power BI Quick Tips.

