Recursive Data Analytics: How DataOps Dashboards Improve Insights

In the last two years the continuous integration and deployment (CI/CD) approach in data analytics has gained more visibility and attention than ever. Companies that understand the importance of fast data insights are creating short cycles of data and analytics development and adopting techniques for continuous integration, testing, and deployment. The DataOps movement is a natural step in the data lifecycle evolution that was inevitable because all areas of IT including data science and machine learning are heading this way, too.
Lean, mean, agile data machine
One of the fundamental DataOps principles states that analytics is manufacturing, and therefore, it must be lean and efficient no matter how big the data estate is. Analytics should be constantly monitored and agile, or easy to change. The efficiency of data pipelines can be achieved though the carefully crafted Build-Measure-Learn cycle proposed by Eric Ries in his famous book Lean Startup. In essence, data pipeline development accompanied with comprehensive monitoring and detailed outcome analysis makes the analytics leaner and more efficient.
Even though well-orchestrated data pipeline development is often seen as a hard and tricky process, especially when multiple data sources and large volumes of data are involved, the monitoring part of the cycle gets occasionally neglected or simplified to a small number of key performance metrics. In reality, it is sophisticated enough. The reason is that data pipelines combine both dynamic (services, network) and static (data quality, consistency, security) features that need to be assessed in order to get insights into what can be improved.
The first, dynamic component doesn’t have any lack of attention – the market is booming. According to Persistence Market Research, the global IT infrastructure monitoring market is steadily growing and is expected to reach a market value of US $34.1B by 2024. Part of this market is attributed to the data monitoring niche where data platforms are examined for KPIs such as throughput, latency, disk queues, query execution times, and so on.
By contrast, the other, static component of the process is not so straightforward. While there are many data management solutions – data catalogs that offer comprehensive overview of data estate, governance and security compliance – quite often a custom solution is required to gain deep understanding of complex data architectures. When this happens, the recursive data analytics can be a good choice.
So, what exactly is recursive data analytics?
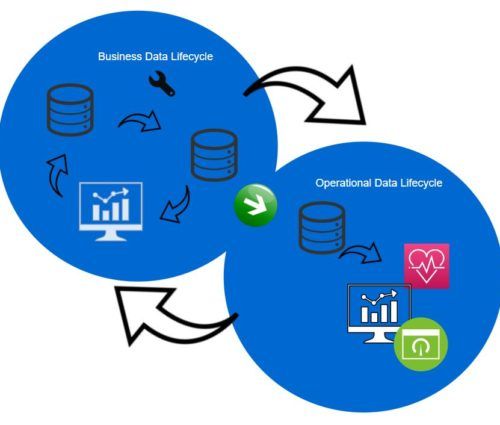
Recursive data analytics is the data processing framework that drives its own innovation cycles. The term “recursive” refers to how data generates new data. This, in turn, improves the understanding, quality, and value of the original data. Then, the process repeats recursively. Sometimes it can branch into new analytical initiatives that came up though patterns in systems generated, not original data. To fully understand the idea, refer to a simple diagram below where data pipelines used to prepare data for business dashboards (shown in blue) generate operational statistics to feed DataOps dashboards. leading to insights into how to increase efficiency and add value to the business data pipeline.
When CI/CD is carefully integrated into data workflows and business data pipelines are driven by the code written to not only process that data but also to record performance metrics and collect data quality exceptions, the operational data becomes an asset that can be examined, mined, and actioned upon. The key point here is when this data is treated just like any other data, it can provide enormous value.
Starting the journey to recursive analytics
This simple checklist can help assess the current state of data pipelines and identify opportunity for change:
- Document all data pipelines and how they are monitored. Occasionally, changes in data support teams or a need to complete an important business assignment leaves part of data management processes completely unmonitored. This opens the opportunity to explore and understand additional dependencies and patterns.
- Examine loggers, monitoring and integration tools to understand what kind of data they can generate besides what is already available and how that data can be accessed (file system, APIs, endpoints, databases etc.). Advanced logging features may be switched off by default leaving hidden gems to those who are truly interested in digging deeper.
- Catalog the data to understand the structure, state, relationships, dependencies. Don’t forget to ensure it is properly protected.
- Create mapping between data from different loggers and tools.
- Start mining and analyze. Once the current state is fully explored, assess which processes may benefit from additional monitoring through custom added code.
Dashboards have become an important tool for business decisions, and so should they be for every data services team. Applying DataOps principles to data management and mastering recursive analytics is the cornerstone for building agile and efficient data analytics.
Curious to learn more? I will be speaking about DataOps at the Data Architecture Summit 2019 in Chicago on October 14, 2019.