Empowering Your Power Platform with Microsoft Copilot

Microsoft Copilot is revolutionizing development on the Power Platform by leveraging AI (Artificial Intelligence) to support the creation of intelligent applications. Microsoft has been investing heavily in this technology, continually enhancing and advancing Copilot's features. Although Copilot is still in its early stages and may occasionally provide incorrect answers, it learns from user interactions and feedback, constantly refining its suggestions.
Benefits of Copilot:
- Assists first-time users with minimal coding experience in building simple solutions.
- Streamlines the development process.
- Increases efficiency and effectiveness.
- Provides helpful links, hints, and steps during development.
- Automates routine tasks.
- Offers insights based on data and prompts.
This post explores how Copilot enhances various components of the Power Platform, including PowerApps, Power Automate, Power Pages, Power Virtual Agents, and Power BI.
Understanding the Components of the Power Platform
- Power BI: Reporting and analyzing data
- Power Apps: Building applications
- Power Automate: Automating tasks
- Virtual Agents: Creating chatbots
- Power Pages: Building external web pages

Copilot with Power Apps
Within Power Apps, Copilot assists in prototyping applications based on your ideas, building the app, formatting data, creating formulas, and interpreting those formulas. Using natural language prompts, Copilot can build interfaces, databases, and backend logic.
Prototyping Example
For instance, when I requested information on different state flags, Copilot generated a table named "State Flags" with appropriate columns and sample data.
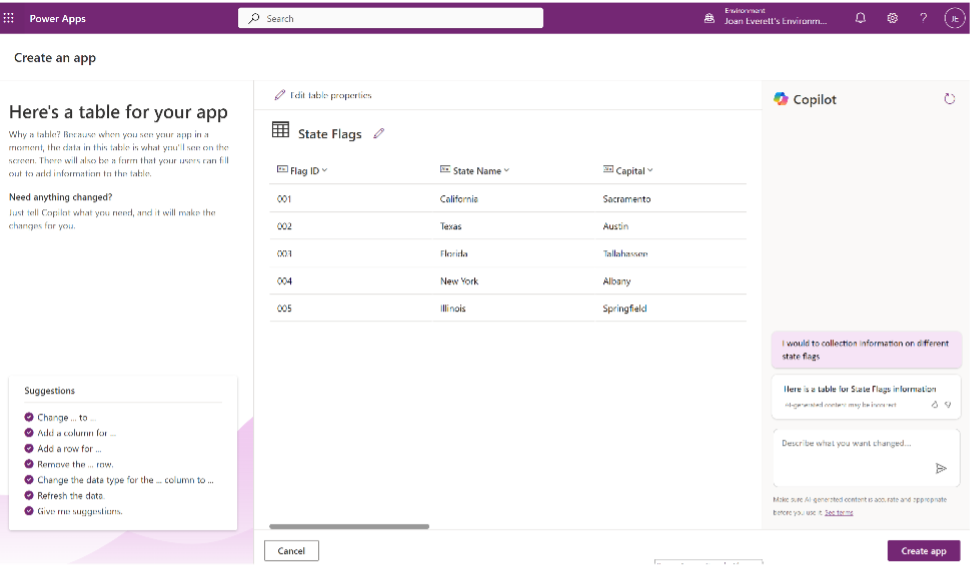
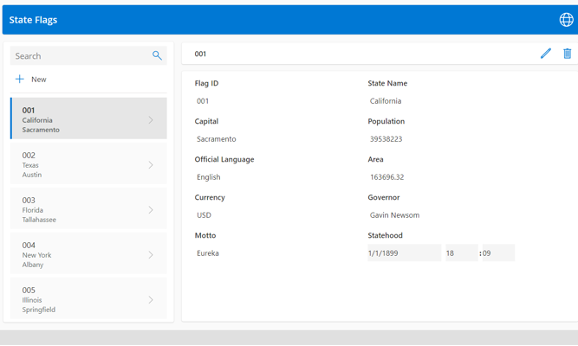
Next, by simply choosing “Create,” a Canvas Power App was automatically generated.
Building an Application
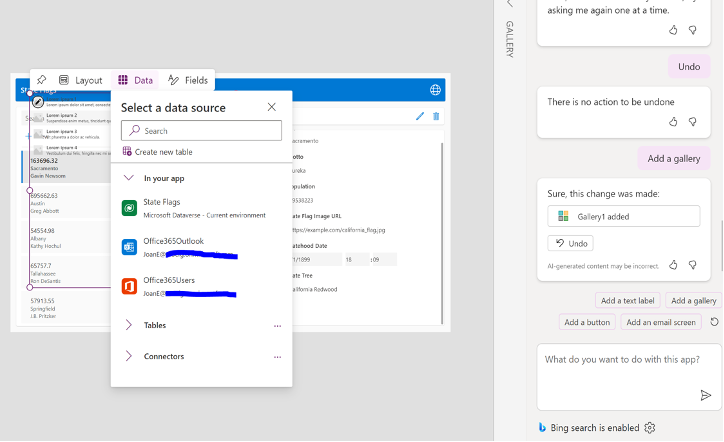
After creating the initial application, Copilot offers additional tips for faster development. On the right-hand side of the app, you can start asking questions to receive help, steps, and links to relevant references.
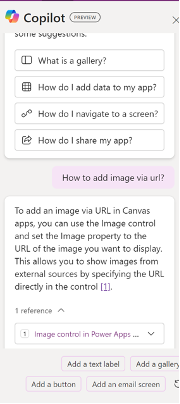
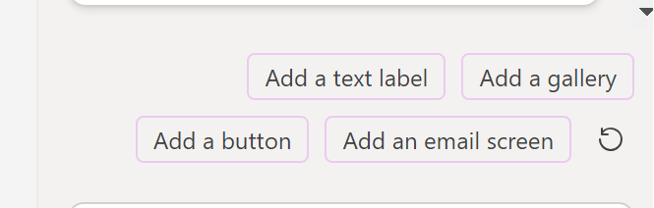
Copilot also suggests items to add to your application. In this example, I added a gallery, which was seamlessly integrated into the app.
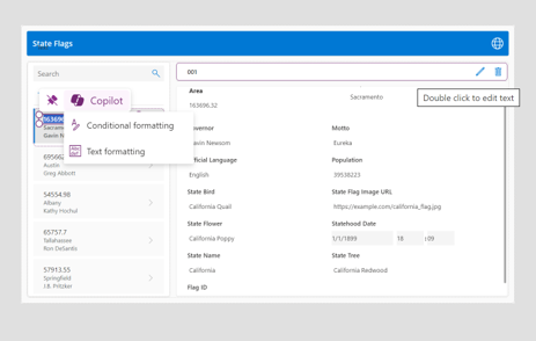
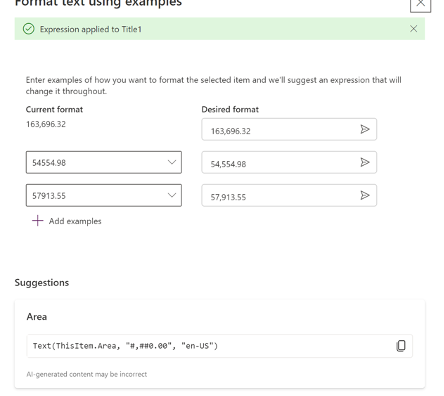
Formatting Data
Copilot can simplify data formatting. For example, it can format fields and text with just a click. You provide a couple of examples, choose the desired format, and apply it.
Building and Explaining Formulas
Copilot also helps with creating formulas. You can add comments, and Copilot will generate recommendations on how to code. However, since this feature is relatively new, always verify the generated formulas for accuracy.
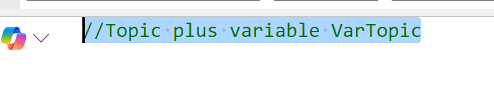
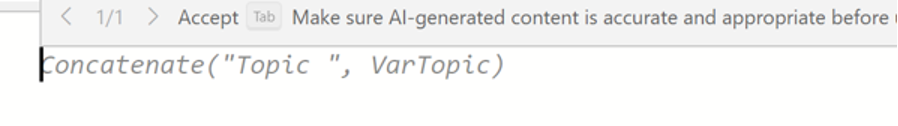
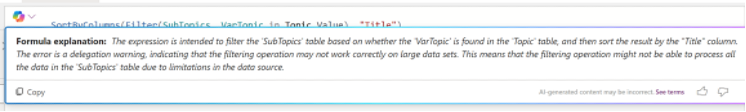
When you need to understand what a formula does, you can ask Copilot for an explanation. This is especially useful when debugging.
Copilot with Power Automate
In Power Automate, Copilot acts as a personal advisor, simplifying workflow development by enabling an open-ended conversational experience to create flows and advise on the next steps.
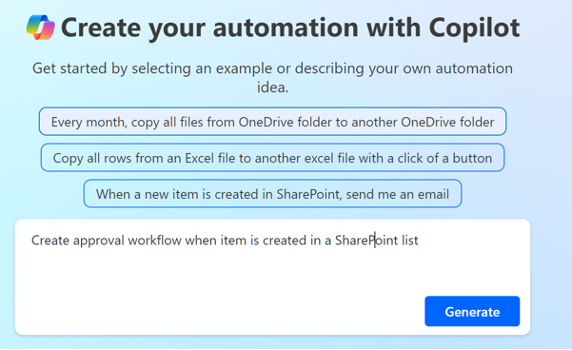
Creating an Automated Task
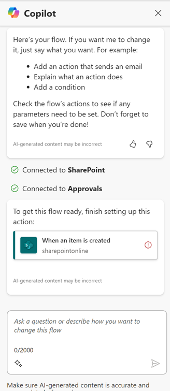
You can start with a suggestion, and Copilot will recommend actions to trigger the flow and necessary steps or actions. Once you click “Next,” it will create the Power Automate flow.
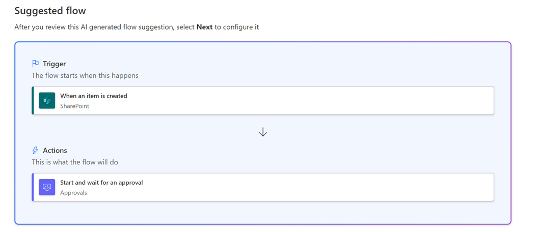
Suggesting Next Steps
After the initial creation, Copilot will suggest adding conditions or actions and inform you of items you still need to configure. This saves time searching for the correct actions or conditions for your flow.
Copilot with Power Pages
Copilot streamlines the process of creating external sites, page layouts, and forms. It can also assist with formatting text and content sections.
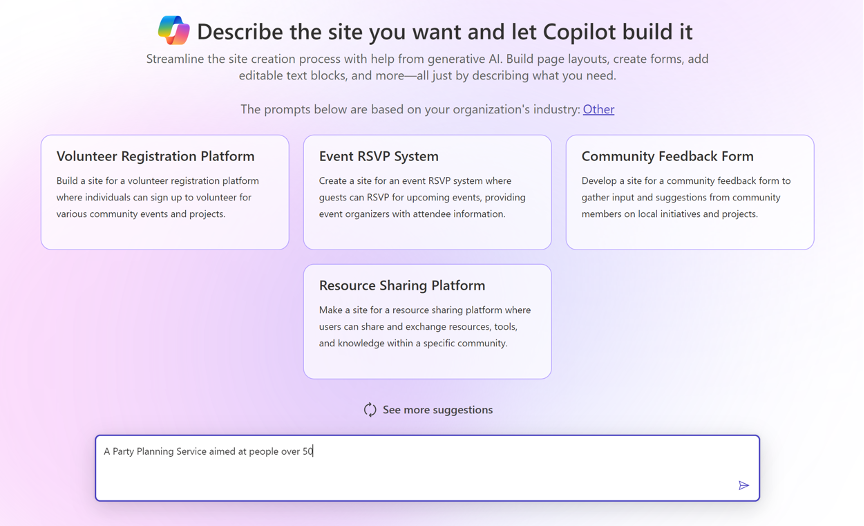
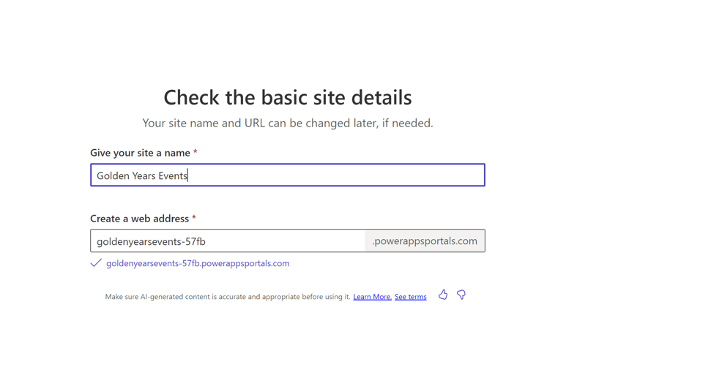
Assisting with Site Creation
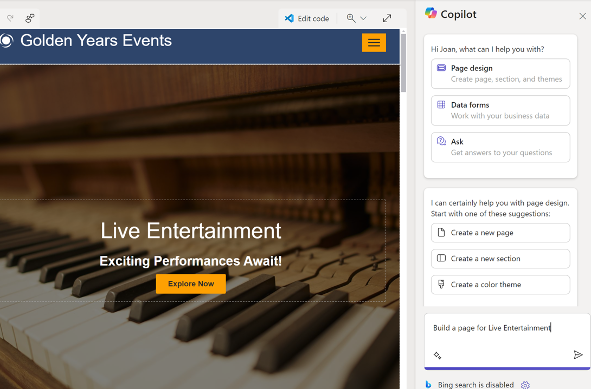
Provide a brief description of the site you want to create, and Copilot will turn your description into a fully functional site. For example, to create a “Party Planning for People over 50” site, Copilot suggests a URL and name for the site, generating a layout and images automatically.


Creating a Page
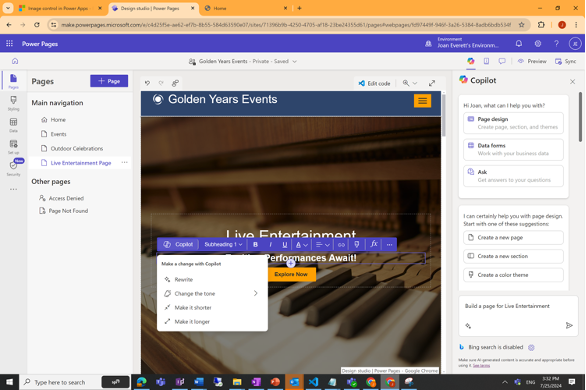
Once you have the basic site and you are ready to expand additional page content, click on the Copilot icon and it will start advising on various items. You can regenerate a page with different layouts, removing the need to build a page from scratch.
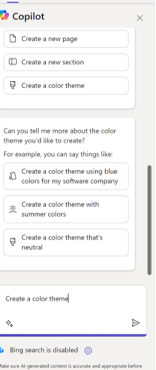
Copilot allows you to pick a layout you like and modify text, change the tone, rewrite, and adjust the length of the content.
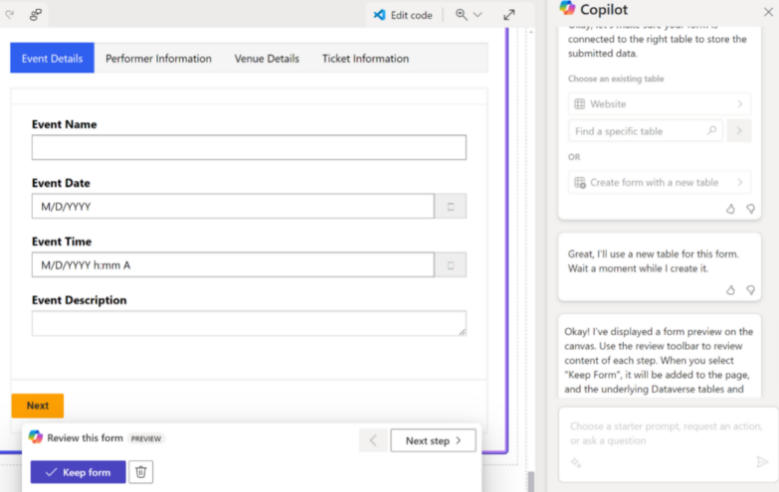
Building a Form
With a few prompts, Copilot can build simple or more advanced forms with tabular layouts. This feature is a significant time-saver.
Copilot with Power Virtual Agents
Copilot in Power Virtual Agents, as part of Copilot Studio, speeds up the creation of chatbots leveraging natural language prompts and AI to help create and iterate over topics. Virtual Agents can engage with customers and employees across multiple channels, including websites, mobile apps, Facebook, and Microsoft Teams.
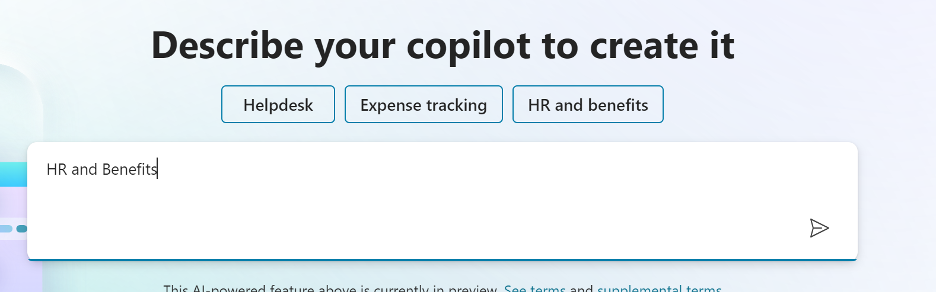
Building a Chatbot
For example, by typing in “HR and Benefits,” Copilot generated a basic chatbot.
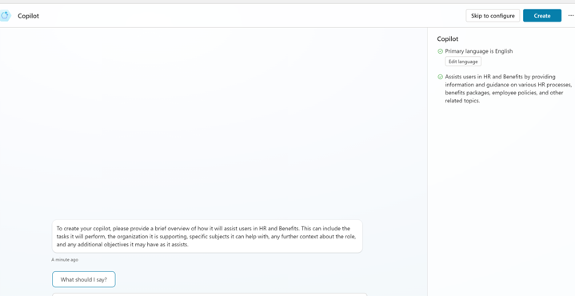
Microsoft then asks for the primary language and purpose of the chatbot to tailor its development.
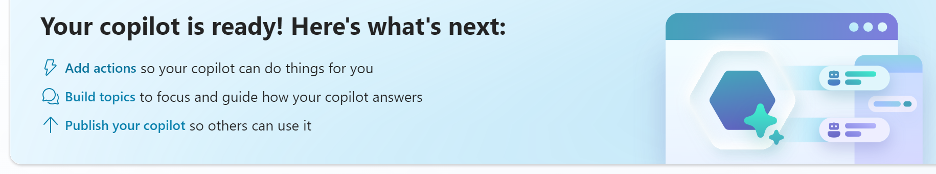
Assisting with Next Steps
Copilot can help trigger actions, guide you on building topics, and assist in publishing your chatbot. The chatbot can then be refined and trained based on your needs, with suggested next steps from Copilot or modifications by your team.
Copilot with Power BI
Integrating seamlessly with Power BI, Copilot assists with data modeling, report visualizations, and supports users by providing real-time insights and analytics.
Building a Data Model
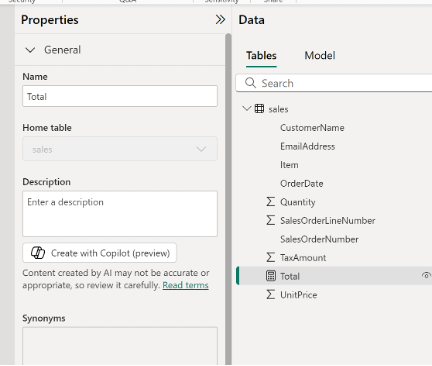
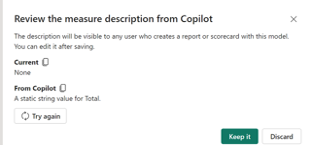
In data modeling, Copilot can help build descriptions for measures and create DAX queries based on raw data you’ve provided.
For example, on “Create with Copilot (preview)” for a measure called “Total,” Copilot generated a description automatically.
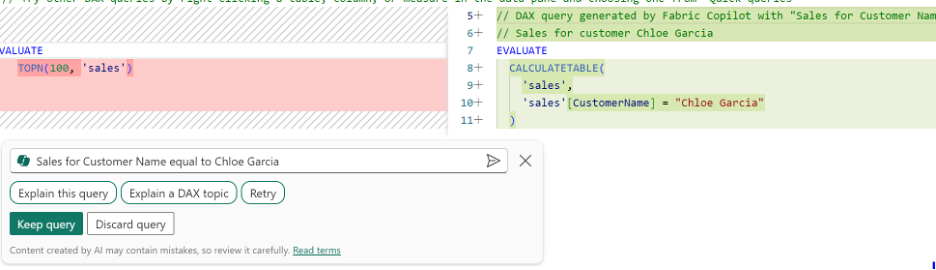
You also can use Copilot to write DAX Queries. By clicking on the Copilot icon and asked to find Sales for a specific individual, Copilot generates the necessary DAX query, which can be incorporated into your logic by clicking “Keep Query.”
Authoring Reports
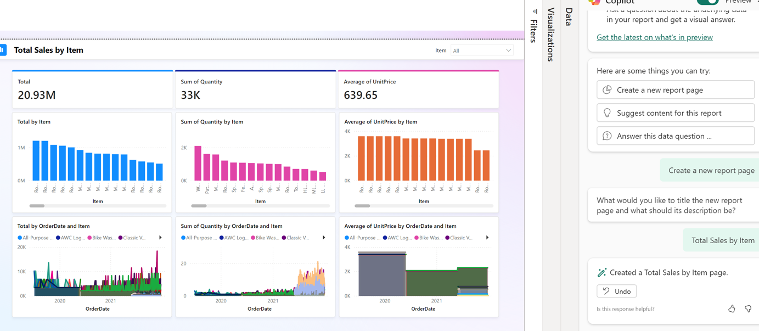
Often, the report author and the data model owner are different individuals. As a report author, you can have Copilot build reports, add content to existing reports, or identify what is in the current data model. For example, by prompting Copilot to create a new report, additional questions help refine the title, description, and content. In one instance, a report was generated for “Total Sales by Item.”
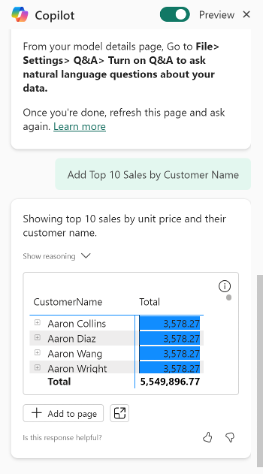
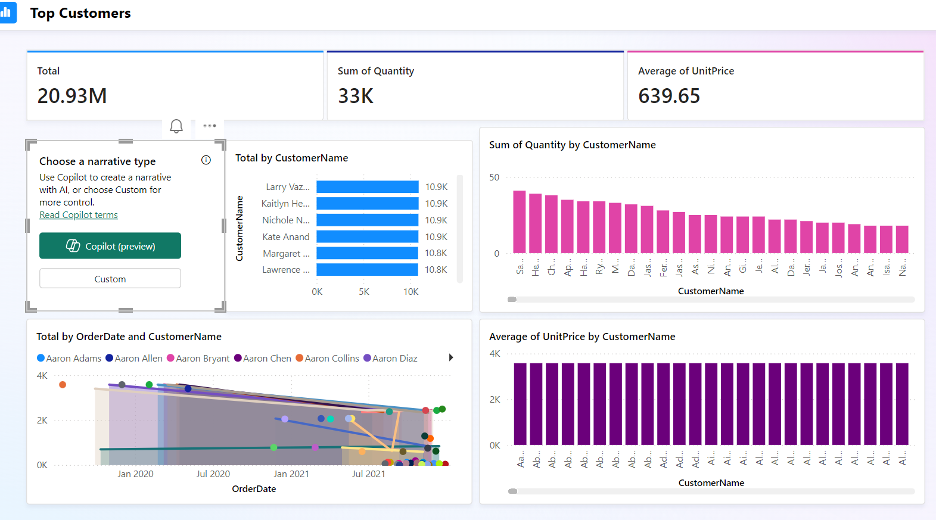
Once the page is built by Copilot, you can easily add more content by prompts such as “Add the Top 10 Sales by Customer Name.”
If you aren’t exactly sure what content you want and are exploring the data model, Copilot’s Data Overview feature helps you understand the data you’re working with before building the report.
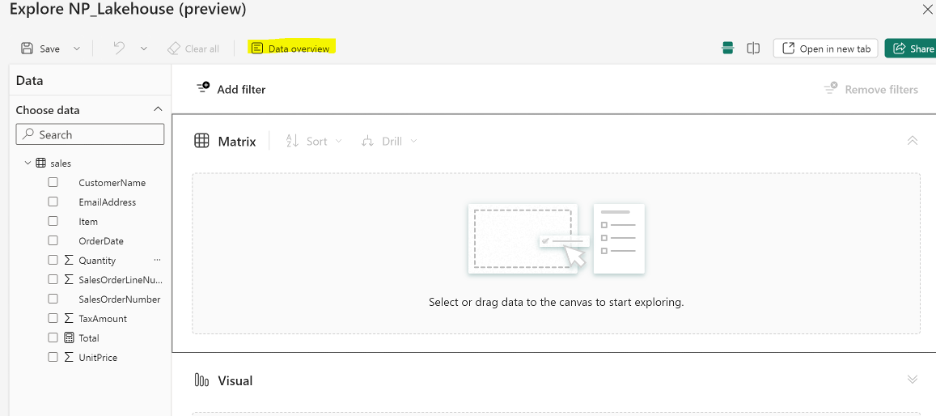
The Data Overview will describe what is available. This is helpful to know what is in the data model before building the report.
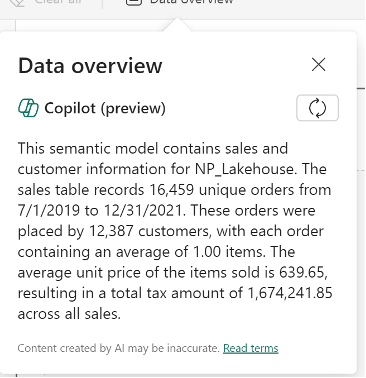
In addition, to supporting report building, Data Overview can be used to help users understand the data behind the report establishing trust and context through data transparency.
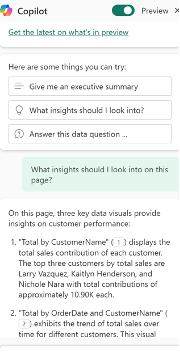
After I click on Copilot it will provide a summary of the page.
Understanding a Report
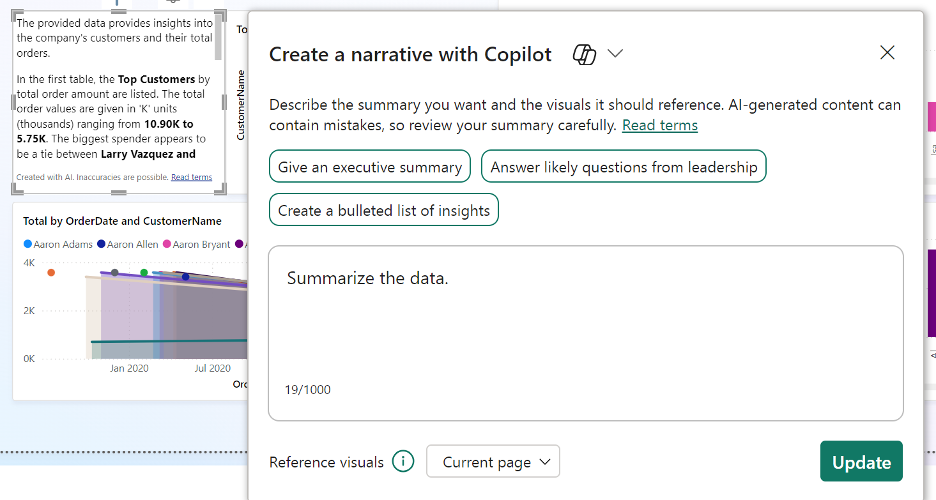
After a report is published, users can use Copilot to request an executive summary, gain insights, or ask specific questions, enhancing the depth and clarity of the insights provided.
Copilot can support you and your organization across the Power Platform, benefiting both creators and users. Microsoft continues to expand Copilot's features for each service. Keeping up to date on the latest Microsoft Copilot roadmap and announcements will help your organization get the most out of your Copilot investment. The time is now to start using Copilot, as it is only getting better. SPR can assist with training sessions on the Power Platform, no matter where you are in the process:
- Blueprinting: Uncover business cases that will optimize your processes.
- Build: Architect and implement solutions following Microsoft best practices utilizing the latest technologies.
- Governance: Implement processes to empower your users and protect your organization with user training, a center of excellence, or advisory services.