Reusable Responsive Charts Built in Angular/Ionic Apps – Part 1
When it comes to charting libraries in Javascript, some of the popular ones are HighCharts, amCharts, Chart.js and D3.js. Most of these libraries make it very easy to build charts for most common needs, by specifying axis configuration, multi-dimensional data and little else. This works for most scenarios. Occasionally, we run into a charting/graphing need that is not easily accomplished with such configuration driven approach. We need the library to allow us to get under the hood and build a graph from the ground up. Having had to build a few of these professionally in last few years, I found that D3.js has the best tools when it comes to greater control. And yes, you guessed it, with a slightly higher learning curve and complexity to manage.
Wouldn’t it be nice to build a facade on top of D3.js that allows us to build simple charts using its configuration? Sure, yes. And, that is what libraries such as NVD3, C3 aim to accomplish. My own opinion is that once we take the time to understand D3 philosophy and its fundamentals, it is not very hard to build reusable components that make simple charts simple/configurable and complex graphs possible without a lot of headache.
This is a two part article. In part-1, we will see how to build such a reusable component (via factory and directive in case of AngularJS framework), what allows us to build simple charts easily. In part-2, we will enhance the reusable component to support building responsive charts for hybrid mobile applications (specifically for ionic framework).
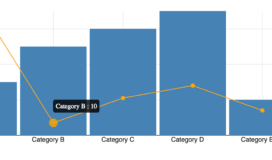
Let us start with a simple multi-series chart. In this chart, the bar-series is plotted along the left axis and the line series on the right axis. The complete example can be found on Github:
Here are important patterns used to build this example.
Step 1: Creating Chart Definitions
The chart definition component is built on the concept of reusable chart patterns as defined in this link.
Let’s create a module ‘widgets’ to which we will add our chart definition factories. Later on it helps to extract the module and reuse in Ionic app.
In order to expose this reusable chart component in the Angular application, we use Angular Factories. Our factory class builds a chart with a bar series and a line series (see code for details, familiarity with D3 assumed).
[code language=”javascript”]
angular.module(‘ngD3Example.widgets’).factory(‘barLineChartFactory’, barLineChartFactory);
/* @ngInject */
function barLineChartFactory(chartUtils) {
var chartFactory = {
create: function () {
return new LineBarChart();
}
};
function LineBarChart() {
var props = {
width: 300,
height: 300,
barSeriesValueField: ‘valueLeft’,
lineSeriesValueField: ‘valueRight’,
xAxisValueField: ‘label’
};
function exports(selection) {
// Here we build chart scales using D3 scale functions
// and use line and bar helper functions to draw series
}
function drawLineSeries(xScale, yScale, data, chartGrp) {…}
function drawBarSeries(xScale, yScale, barWidth, data, chartGrp) {…}
exports.width = function (w) {…}
exports.height = function(h) {…}
exports.barSeriesValueField = function(valueField) {…}
exports.lineSeriesValueField = function(valueField) {…}
exports.xAxisValueField = function(valueField) {…}
return exports;
}
return chartFactory;
}
[/code]
To demonstrate the power of this pattern for code reusability/maintainability, let’s try to add tooltips on the chart. We will add new a tooltip factory class as follows:
[code language=”javascript”]
angular.module(‘ngD3Example.widgets’).factory(‘tooltipFactory’, tooltipFactory);
/* @ngInject */
function tooltipFactory() {
var tooltipFactory = {
create: function () {
return new tooltipGenerator();
}
};
function tooltipGenerator() {
var tooltipFn;
function exports(selection) {
function positionTooltip() {…}
function removeTooltip() {…}
function addTooltip(d, i) {…}
selection.on(‘mouseover’, addTooltip)
.on(‘mousemove’, positionTooltip)
.on(‘mouseout’, removeTooltip);
}
exports.tooltipFn = function (fnIn) {};
return exports;
}
return tooltipFactory;
}
[/code]
Now inject this tooltipFactory into our barLineChartFactory and call tooltip as follows. The concept can be extended as we find the need to reuse specific logic as part of the chart building needs.
[code language=”javascript”]
var tip = tooltipFactory.create()
.tooltipFn(function(d, i) {
return ‘calculatedToolipValue’;
});
var seriesDots = lineDotsGrp.selectAll(‘circle’)
.data(data || []);
seriesDots.enter().append(‘circle’).call(tip);
[/code]
Step 2: Building chart component directive using chart defintions
Once the definitions are ready, we can expose it using the Angular directive for consumption into the application, as follows.
[code language=”javascript”]
angular.module(‘ngD3Example.widgets’).directive(‘barLineChart’, barLineChart);
/* @ngInject */
function barLineChart () {
var directive = {
bindToController: true,
controller: BarLineChartController,
controllerAs: ‘vm’,
link: function(scope, element, attrs, vm) {
scope.$watchCollection(‘vm.chartData’, vm.drawChart);
}
};
/* @ngInject */
function BarLineChartController($element, barLineChartFactory, chartUtils) {
var vm = this,
chart = barLineChartFactory.create(),
chartContainerEl = $element.find(‘.chart-content-container’);
vm.drawChart = function() {
var parentDom = chartContainerEl[0],
el = d3.select(parentDom),
svg = chartUtils.selectOrNew(el, ‘svg’, ‘bar-line-chart’);
svg.attr({
width: chartWidth,
height: chartHeight
});
chart.width(chartWidth)
.height(chartHeight);
// And set other fields..
d3.select(svg)
.datum(vm.chartData)
.call(chart);
}
}
return directive;
}
[/code]
Step 3: Making responsive
This is good so far but as we might notice, the chart does not resize when the window is resized. Let’s create a factory in Angular which can invoke draw on window resize for our chart component and any new chart components we may build. It is also important to unbind the listener to prevent memory leak when the directive destroys . Note that the watchWindowSize function centralizes this logic. Here’s what our window resize handler might look like –
[code language=”javascript”]
angular.module(‘ngD3Example.core’).factory(‘viewportUtils’, viewportUtils);
/* @ngInject */
function viewportUtils($window) {
var utils = {
watchWindowSize: watchWindowSize
}
function onWindowResize(listener) {
var winEl = angular.element($window);
winEl.bind(‘resize’, listener);
return function () {
winEl.unbind(‘resize’, listener);
};
}
function watchWindowSize(scope, listener) {
var unRegisterFxn = onWindowResize(listener);
scope.$on(‘$destroy’, unRegisterFxn);
}
return utils;
}
[/code]
Now let’s use this in our directive to call chart redraw.
[code language=”javascript”]
link: function(scope, element, attrs, vm) {
viewportUtils.watchWindowSize(scope, vm.drawChart);
scope.$watchCollection(‘vm.chartData’, vm.drawChart);
}
[/code]