Reusable Responsive Charts Built in Angular/Ionic Apps – Part 2
 In part 1, we reviewed the process of building reusable D3 charts in the Angular application. In this part-2, we wish to reuse the chart widget from the Angular app in the Ionic app. First, let’s add some features to our chart widget to handle responsiveness in the mobile application. Let’s say that when the chart is displayed in a phone layout, we want to display the y-axis tick values on the inner side of axis (inside the chart plot area) and drop the space reserved on the left and right sides to give more space to the chart drawing. In order to identify various mobile screen layouts, we will need to add support in our code to identify media query breakpoints. We will utilize media query features provided by the Angular material library via $mdMedia service. Angular material is my go to library for other web widgets support in Angular apps.
Let’s add Angular material to project, by injecting the material library dependency to the ‘core’ module.
[code language=”bash”]
bower install angular-material –save
[/code]
[code language=”javascript”]
angular.module(‘ngD3Example.core’, [‘ngAnimate’, ‘ngAria’, ‘ngMessages’, ‘ngMaterial’]);
[/code]
Now, let’s expand viewportUtils to expose media query support. We will create a watch on each breakpoint exposed by mdMedia service and exposed it to $rootScope so that we can use the entire application either in JS code or in html templates as needed per requirements.
[code language=”javascript”]
function viewportUtils($window, $mdMedia, $rootScope) {
//See viewport-utils.js for full code. All media query points are supported in the following manner.
$rootScope.viewportXs = $mdMedia(‘xs’);
$rootScope.$watch(function() { return $mdMedia(‘xs’); }, function(val) {
$rootScope.viewportXs = val;
});
}
[/code]
Let’s tweak our bar line chart D3 definition factory class to utilize these variables to draw axis ticks on inner side of chart plot for the phone layout. The phone layout is identified by ‘xs’ breakpoint which is defined as ‘max-width: 599px’.
[code language=”javascript”]
angular.module(‘ngD3Example.widgets’).factory(‘barLineChartFactory’, barLineChartFactory);
function barLineChartFactory(chartUtils, tooltipFactory, $rootScope) {
function lineBarChart() {
function(exports) {
marginLeft = $rootScope.viewportXs ? 5 : 70; //reduce margin to give more space to chart drawing
marginRight = $rootScope.viewportXs ? 5 : 70;
var yAxisLeftOrient = $rootScope.viewportXs ? ‘right’ : ‘left’;
var yAxisLeft = d3.svg.axis()
.scale(rawYScale)
.orient(yAxisLeftOrient);
}
}
}
[/code]
There are cases when the change in responsiveness we need can simply be handed via CSS. Let’s see how to handle it via media queries in CSS. I like to use Sass in order to better manage stylesheets. In the previous part I simply added CSS files and here I have converted them to Sass. We will also use the gulp build system and plugins to convert Sass to CSS to on every change in the Sass file. In order to manage gulp plugins, we need npm.
[code language=”bash”]
npm init
npm install gulp –save
npm install gulp-sass –save-dev
[/code]
Now create a main SCSS file in the ‘styles’ (src/client/styles) folder and create a folder structure to mimic the code folder structure. I like to use this practice in order to find the styles for a given component easily. I add mixins and common styles to a base folder, let’s add a media query mixin in the ‘base’ folder. Since I want to be consistent with the way media query breakpoints handled in code, I am defining media query conditions as what is defined in the Angular material library.
[code language=”css”]
@mixin respond-to($media) {
@if $media == screen-xs {
@media only screen
and (max-width: 599px)
{ @content; }
}
} // See code for full list of media query points
[/code]
Here is the gulp task to compile the SCSS file in CSS and perform this action on every save on the SCSS file via gulp watch.
[code language=”javascript”]
gulp.task(‘styles’, [‘clean:styles’], function(done) {
gulp.src(config.styles)
.pipe(sass())
.pipe(gulp.dest(config.temp))
.on(‘end’, done);
});
gulp.task(‘watch’, function () {
gulp.watch([config.styles], [‘styles’]);
});
[/code]
Let’s say we want to reduce the font size of the axis tick values on the phone layout. Here’s how we update the CSS containing font size:
[code language=”css”]
.axis {
font: 12px sans-serif;
@include respond-to(screen-xs) {
font-size: 10px;
}
}
[/code]
Now as we resize the browser and reduce the viewport size to phone layout, our media query triggers the discussed changes.
Now, let’s see how to reuse the chart’s code in the Ionic mobile app. The ‘core’ and ‘widgets’ modules contain all the code required to draw the chart and to respond on media queries. Let’s put together a gulp task to export those modules code in minimized format then a gulp task to export stylesheets in minimized format. We will upload those files to a github repository to be utilized in other Angular/Ionic projects via bower.
[code language=”javascript”]
gulp.task(‘publish-common’, function() {
runSequence( [‘publish-common-js’, ‘publish-common-css’],
‘git-clone-repo’, ‘git-commit’, ‘git-push’);
});
[/code]
Let’s get started with creating an Ionic project to utilize our common code to draw D3 charts. I’m using a blank template from the Ionic starter templates to generate a skeleton (It is assumed that Ionic is installed).
[code language=”bash”]
ionic start ionic-D3-example blank
[/code]
Now update bower.json as follows to get the common code in the Ionic application and do ‘bower install’:
[code language=”bash”]
{
"devDependencies": {
"ngD3Example-common": "https://github.com/pjain11/bower-ngD3Example.git"
}
}
[/code]
Now add the dependency to shared modules in the Ionic application.
[code language=”javascript”]
// widgets-shared.module.js
angular.module(‘ionicD3Example.sharedWidgets’, [
‘ngD3Example.core’,
‘ngD3Example.widgets’
]);
//app.module.js
angular.module(‘ionicD3Example’, [‘ionic’, ‘ionicD3Example.sharedWidgets’, ‘ionicD3Example.layout’])
[/code]
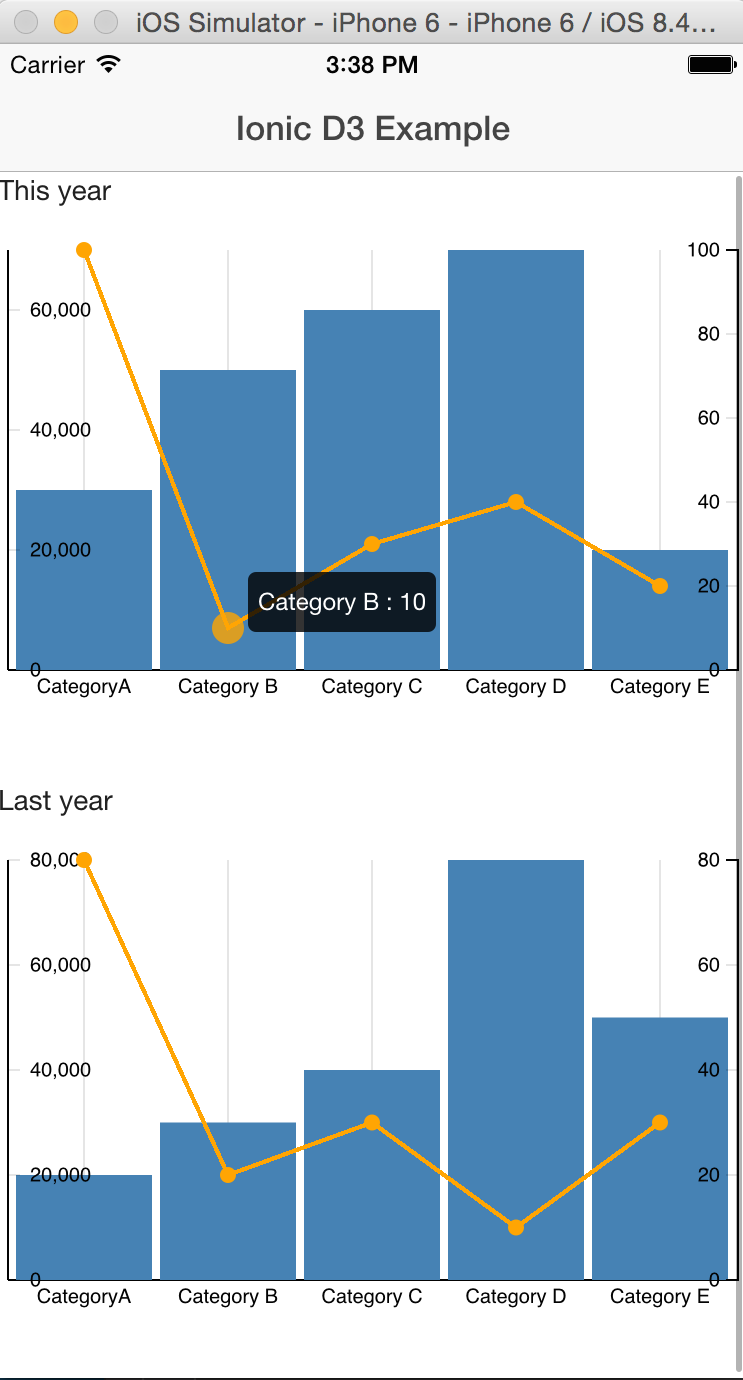
Now we can start using the chart directive in our Ionic templates. I created shell.html and added two instances of the directive and bound different data. In tablet mode, we see charts in one row and in phone mode they appear in two rows. In order to handle this type of layout, I am using Angular material layout CSS since it is already a dependency as we use a part of common D3 code. One can use Ionic layouts as well. A full working example of the Ionic D3 application can be found at this github repo.
[code language=”html”]
<ion-content>
<div layout-gt-sm="row" layout="column">
<div bar-line-chart data-chart-data="vm.data"
data-line-series-value-field="unitsSold"
data-bar-series-value-field="revenue"
data-x-axis-value-field="label"
data-title="This year" flex-gt-sm class="chart" layout="column">
</div>
<div bar-line-chart data-chart-data="vm.data2"
data-line-series-value-field="unitsSold"
data-bar-series-value-field="revenue"
data-x-axis-value-field="label"
data-title="Last year" flex-gt-sm class="chart" layout="column">
</div>
</div>
</ion-content>
[/code]
While working on a feature, one might want to test the common module code on dependent projects locally before pushing to common repository. Here’s a sample gulp watch function for the published JS and CSS. The output goes to ‘dist’ directory in Angular project. You can do ‘bower link’ in dist folder which will create a global link to the common code to be utilized in the Ionic/dependent project. In the Ionic project base folder, do ‘bower link dist’ to create symlink to dist folder in www/lib folder. In development mode for Ionic, one can use code from dist folder bower link vs. via bower repository.
[code language=”javascript”]
gulp.task(‘publish-common-local’, function() {
runSequence([‘publish-common-js’, ‘publish-common-css’]);
});
gulp.task(‘watch-publish-common-local’, function () {
gulp.watch([‘src/client/**’], [‘publish-common-local’]);
});
[/code]
That’s it. Charts are available in the Ionic application. I extracted common code from the Angular web application for demonstration purposes. One can create a common widgets and services project and extract code to use in web and mobile applications.