Dynamic Calculations: How to Build Them in Power BI

Let’s get this out of the way: Power BI is not Excel.
It’s always interesting to see the unique and unconventional ways users leverage Power BI. Users with a strong Microsoft Excel background approach Power BI as if it were a full replacement for Excel (it is not). This train of thought leads to questions about pivot tables, lookups, functions, macros. The most often asked question? How to create dynamic calculations and perform what-if analysis.
The program does not work the same as Excel, but Power BI does attempt to address this capability via parameters. Parameters provide a mechanism to define a stepped range of values (Whole Number, Decimal Number, Fixed Decimal Number). A defined parameter may be added to a Power BI report as a slicer. The selected value in the slicer can be referenced to create dynamic calculations.
Let’s review how to effectively use Power BI parameters to facilitate dynamic calculations. We will also explore a method to expand their capabilities to reference non-numeric values.
Using Parameters for Dynamic Calculations
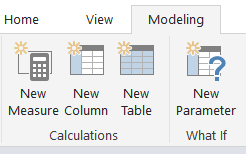
How do we set up dynamic calculations? Let’s start with creating the parameter. Parameters are accessed in Power BI desktop via the Modeling -> New Parameter menu options. Upon selecting New Parameter, a dialog box is presented that allows defining parameter properties:
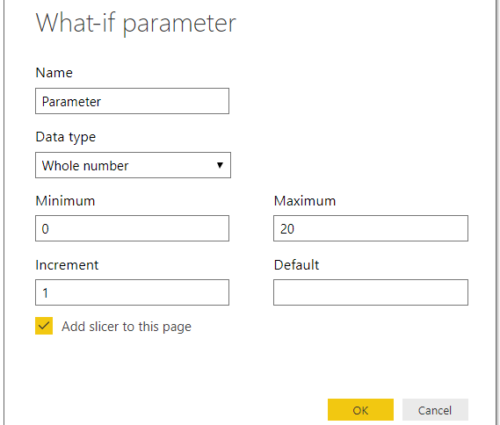
Parameter values are limited to whole, decimal and fixed decimal numbers defined by an increment over a specified range. A default value can also be supplied. For this example, we will be using sample sales data and creating a “Sales Factor” that will be used to adjust sales amounts using the following properties:

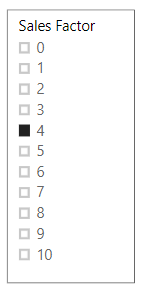
The created parameter appears as a slicer and is added to the Power BI fields as an object with 2 fields: one for the parameter and one for its selected value. The following image depicts the created objects and their associated DAX.
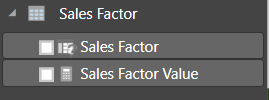
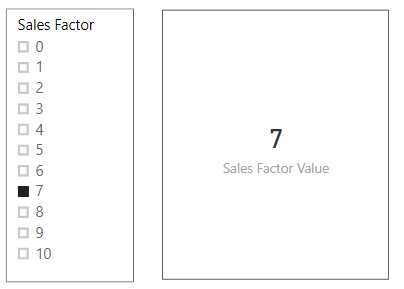
Notice that the “Sales Factor Parameter” field uses the GENERATESERIES function to populate parameter values and the “Sales Factor Value” field uses the SELECTEDVALUE function to retrieve the parameter value. The default value of 1 is returned if more than 1 parameter value is selected. The parameters’ behavior is demonstrated by displaying the “Sales Factor Value” field with a Card visualization.

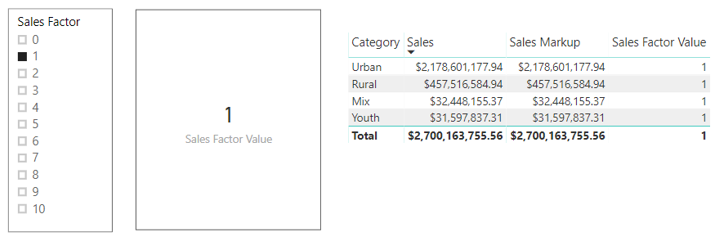
Let’s create a new measure “Sales Markup = ‘Sales Factor'[Sales Factor Value] * ‘Sales'[Sales]” that uses the parameter to multiply “Sales”, and place “Sales Markup”, “Sales” and “Sales Factor Value” in a table to display Sales by Category.
Sales Markup = ‘Sales Factor'[Sales Factor Value] * ‘Sales'[Sales]
Select “Sales Factor = 1”
Select “Sales Factor = 2”
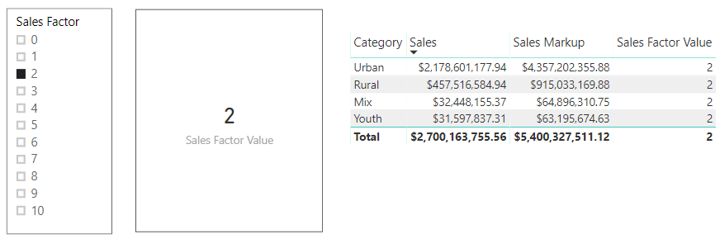
The value of Sales is multiplied by the value of the selected “Sales Factor” to produce “Sales Markup”. So, using parameters is very straight forward; however, what if text values need to be passed as parameters or if the values could not be readily expressed as an incremental range.
Using supplemental tables for dynamic calculations
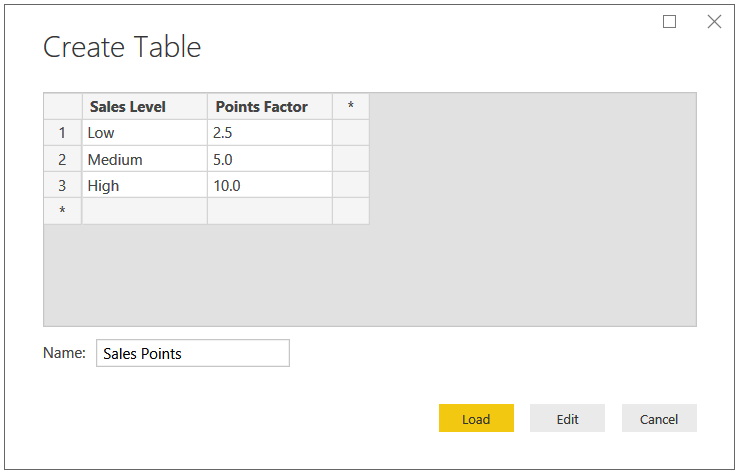
Supplemental tables can be created directly in Power BI or in the data source. For this example, a table created directly in Power BI will be used. A supplemental table can be created using the Power BI “Enter Data” option under the “Home“ tab.
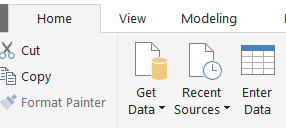
Upon selecting “Enter Data”, a data entry grid is presented that allows you to create a named table, named columns and enter values. Pressing the load button loads the table as an object.
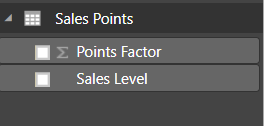
The “Sales Level” field will be added to the Power BI report as a slicer. A new measure will also be created that uses the value of “Sales Level” as an index to the “Points Factor” numerical value.
Here is the measure definition:
Sales Factor Lookup Value = LOOKUPVALUE(‘Sales Points'[Points Factor],
‘Sales Points'[Sales Level],
SELECTEDVALUE(‘Sales Points'[Sales Level],”Low”))
The resulting measure uses the “LOOKUPVALUE()” function to return the numeric value associated with the slicer selection; alternatively, conditional logic may be used to determine what action to take based upon the selected value of the slicer.
An additional measure is created to multiply Sales by the Sales Factor Lookup Value. Following is the measure definition:
Sales Markup Points = Sales'[Sales] *’Sales Points'[Sales Factor Lookup Value]
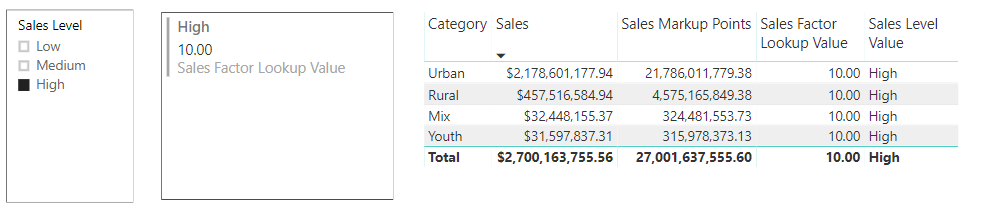
A Sales Level of “High” multiplies Sales by a factor of 10. Sales Markup Points shows the resulting calculated value.
Summary
Parameters and supplemental tables greatly expand dynamic calculation capabilities. These two examples should have provided you insights into ways you can use parameters. Parameters provide an easy and flexible way to facilitate dynamic calculations and extend Power BI analytic capabilities. As an extension, try placing parameter values in files, spreadsheets or database tables and use them as a data source. Once uploaded to the Power BI service, parameters can be updated manually in the Power BI workbook and reloaded. They may also be updated in the underlying data source and loaded using a scheduled refresh.