A Technical Approach for Using ML for Insurance Claim Risk

A great place to start any AI/ML initiative is with a question. In the case of VGM, a healthcare business services company, the question was: Can VGM underwriters make better decisions about future insurance policies by using data they have for current and past customers and policies to determine claim risk? The short answer, yes they can.
Claim Risk - the likelihood a customer during that contract period would file a claim.
Better decisions could mean, for example, using claim risk to identify policies that are potentially riskier based on historical data, allowing underwriters to spend more time reviewing those and less on those with very little projected risk. The process of assisting VGM’s employees to perform their tasks is the first level of AI, Assisted Intelligence, operational maturity.
VGM engaged the team at SPR to create ML models that would support them in making more informed decisions around claims applications. Here’s how we did it.
SPR’s Approach
To work toward providing claim risk, three components were required:
- “Read” historical, non-digital data and merge this data with digital, system data for input into a Machine Learning (ML) model via an automated process
- Create a ML model for determining the likelihood a claim will be filed against a particular policy
- Implement automation to process new applications against the ML model to retrieve the claim risk for applications as they are submitted
Our project team aimed to quickly test our hypothesis that we could predict claim risk. ML projects are more like science experiments. We began with a hypothesis that we hoped to prove true, but we wouldn’t know for sure until we tested it. We needed to create a model with our data to validate whether our hypothesis is correct or not.
Historical Data
When the project was initiated, we started by performing a proof of concept using Document Intelligence Studio for OCR (optical character recognition) to see if it would be effective in pulling data from VGM’s historical data and classifying the types of documents that would be needed for our model. VGM had historical data back to 2016 that was in an unusable format; PDFs and images and documents we needed were stored alongside other information that wasn’t relevant to our project. With some training, DI Studio in Azure worked well for our needs, and we quickly received positive results allowing us to move forward on the ML model.
Transitioning to Modeling
Now that we knew we could access usable data, we transitioned our focus to enabling the team to begin experimenting to prove our hypothesis or utilize our learnings to pivot to a different use case that would business value. This consisted of:
- Creating a process to test an ML model as quickly as possible – both technically and with the business
- Refining the OCR models to provide the needed data to JSON outputs
- Automating the process to execute the OCR models on around 30K documents to produce usable data to input into the ML model
While we were creating the historical data ingestion process, we shaped our first model. The initial model was evaluated based on metrics served as the "guard rails" to help us evaluate the model's performance:
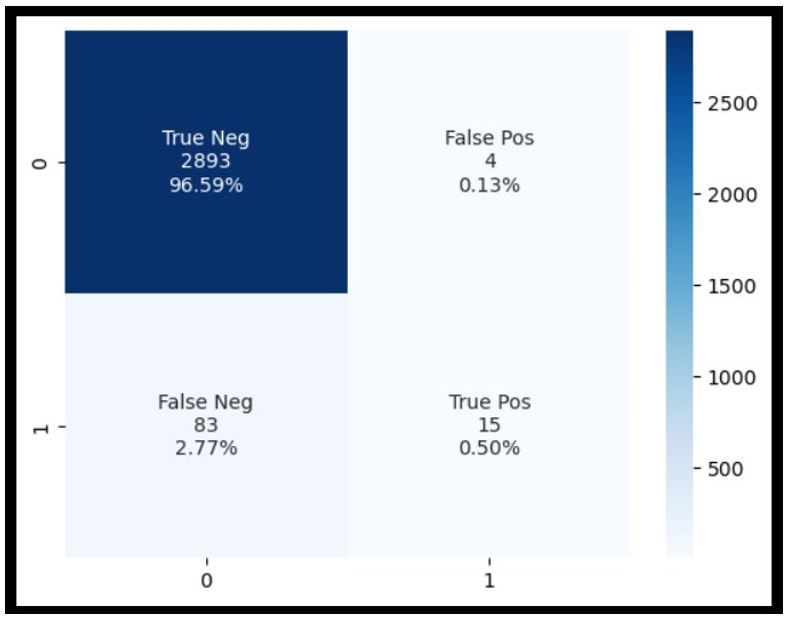
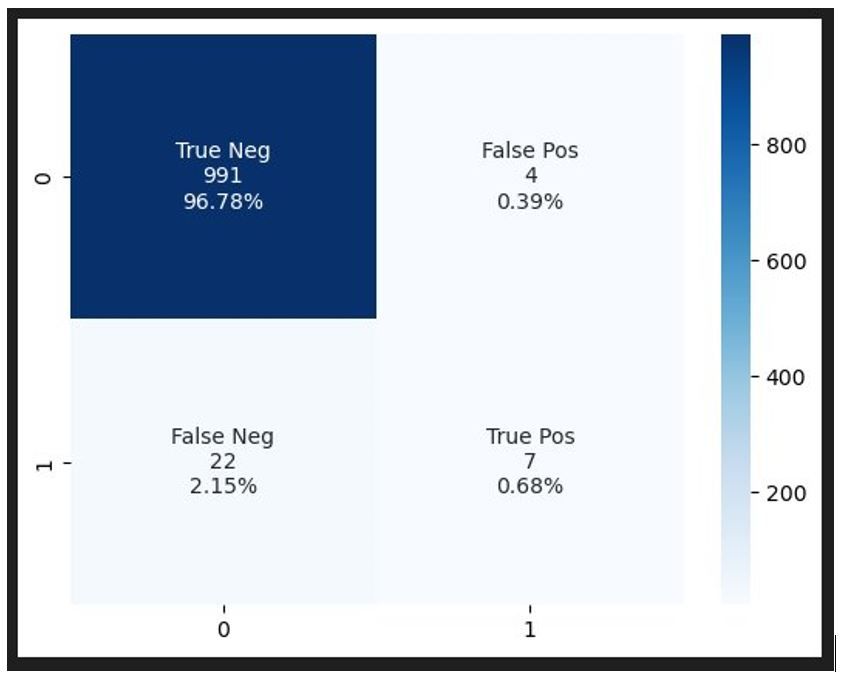
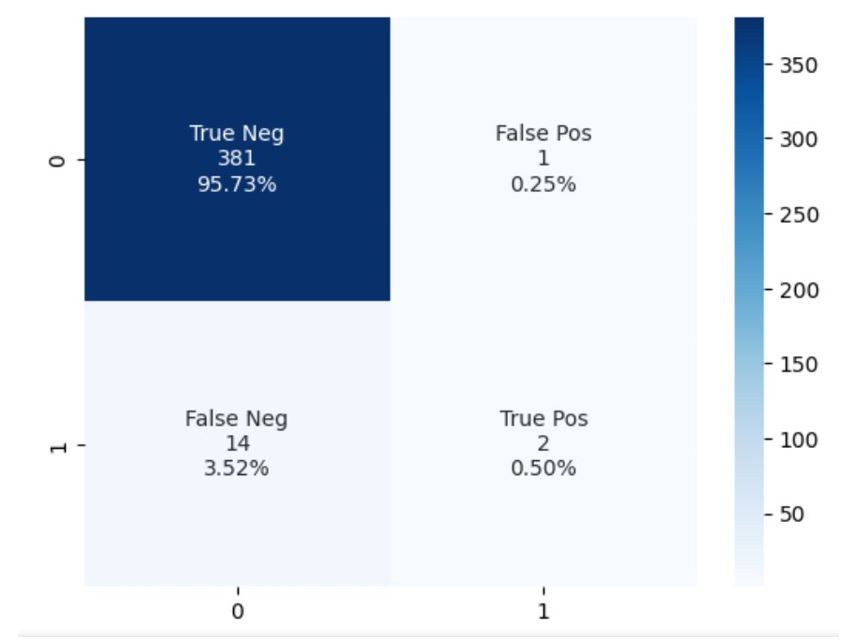
- Confusion Matrix: Breaks down the prediction results by type, which allows us to inspect and tune to reduce False results (or mis-categorizations).
- Precision: In meeting with some of the underwriters, we learned they prefer slightly higher risk sensitivity to lower number of customers, so we tuned and measured the model to skew results in that direction.
- F1: An overall measure of model quality, based on the values and ratios in the confusion matrix.
| Model 1 | |
| Precision | 78.9% |
| F1 | 96.1% |
The result was that the “Fast Track” approach worked as expected. As a team, we were able to process the applications and provide the initial model to VGM. The initial model produced good results, so the next step was to start using the application data.
ML Modeling with Application Data
After finding good results with the first model, the next step was to create ML models using the additional data from the historical, non-digital data set. The historical data had two types of business lines with very different sets of information, so separate ML models were created for each. The hypothesis was that more specialized data could yield a more specialized model and thus better results.
To support this, we ingested 30K documents with our OCR process and stored the usable data in an Azure blob container which we could use to create the ML model input file. We utilized an Azure logic app, called Azure functions to execute the OCR models which initiated the process to create the ML input files.
Business Line 1 Model
For the first Business Line model, two iterations were conducted, and the results were nearly on par with the first model (results below). Even with the more specialized data from the applications, all the top features used by the model were from the original data set, not the historical data.
Feature: an individual measurable property or characteristic. Think of it like a column of data in a spreadsheet.
| Model 1 | Business Line 1 | |
| Precision | 78.9% | 63.6% |
| F1 | 96.1% | 96.9% |
Our findings performance of this model –
- The historical data set included user entry so there are not any controls to force users to populate information and many users were only filling out the questions they believe pertained to them so many of the questions were blank on the initial application submission.
- We had historical data, but the inputs had changed over the years, as they should, however the changes led to a limited amount of consistent, year-over-year data.
Business Line 2 Model
After two iterations, the second Business Line model did not perform as well as the first model. Precision and F1 Scores were lower. This was even after trying a variety of features and hypertuning the best performing model.
| Model 1 | Business Line Model 2 | |
| Precision | 78.9% | 66.7% |
| F1 | 96.1% | 95.0% |
Compared to the other two models, Business Line 2 had significantly less data available. In addition, while having some success using features from the historical, non-digital dataset, many fields did not have enough variety/volume.
Out of this process, the team made recommendations for moving forward:
- Operationalize the first model with core business data
- Experiment with additional models for 2 customer subgroups in the 1st Business Line data. This decision was based on having some success with adding application fields as features in the original 1st Business Line model
Additional Modeling
Refine Model 1 – Core data
We settled on a core feature set, based on performance of past model experiments and desired analytics from the business.
Solidifying this base feature set allowed us to implement a more robust training and testing strategy called “Stratified K-Fold Cross-Validation.” Instead of training once and looking at one set of testing data, we can train 10 times and evaluate performance on 10 different testing sets. This also brought in the use of the performance metric of Recall: The measure of our model correctly identifying True Positives.
Lastly, we experimented with omitting a period of time in the data set, as most of this set would not yet have associated claims history.
As we worked through tuning and review with the business, the business preferred the model more sensitive to claims than less as a first production implementation.
Final Scores
| Model 1 - Refined | |
| Precision | 49.8% |
| F1 | 96.2% |
| Recall | 16.3 |
Subgroup Models
VGM selected two customer subgroups for additional modeling and we utilized the “Stratified K-Fold Cross-Validation” approach that was utilized in the refinement of Model 1.
Subgroup 1 Model
After two iterations of this model, the performance was not on par with combined, Business Line 1 Model even with the subgroup specific data from the core and non-digital, historical datasets. All the top features used by the model were from the core data, not the extracted historical data.
Similar to our earlier findings in the 2nd Business Line model, many of the fields were only filled in by less than 50% of the customers.
| Business Line 1 | Subgroup 1 | |
| Precision | 49.8% | 74.7% |
| F1 | 96.2% | 93.9% |
| Recall | 16.3% | 29.0% |
Subgroup 2 Model
After trying numerous combinations of features on this subgroup specific model, there was no combination that produced results better than the combined, business line 1 model.
The historical data had no positive effect on the scoring of the model. The best observed result from adding this data is they had no effect. In all other cases, the result was worse than the best score using just customer fields.
Again, looking at the data, most of the fields are only filled in by less than 50% of customers.
| Business Line 1 | Subgroup 2 | |
| Precision | 49.8% | 62.5% |
| F1 | 96.2% | 94.0% |
| Recall | 16.3 | 18.1% |
Operationalizing Model 1 into Business Workflows
At this point, we had a chosen model, Model 1, with a level of tuning that was sufficient for the business running in a Jupyter notebook and had determined as a project team that further experimentation at this time was not beneficial, we transitioned to getting the claim risk into the hands of the business.
SPR developed a small processor application called the Claim Risk Processor to make predictions in production. We took the model and incorporated it into an existing business process, so the underwriting team could see this score, along with some analysis metrics, as they make decisions.
Running in Azure, this program waits for new, digital data to enter an input queue. When a new request arrives, the processor reads it, loads the pretrained ML model, and predicts a claim risk score. The processor is the interface between VGM's orchestration middleware, and the ML model. It allows the prediction process to fit into VGM's existing workflows.
In addition to providing the claim risk prediction along with each response, a brief report is included that allows end users to gain insight about key features the model used to create the prediction. In addition, statistical tools were used to generate visuals detailing how much a specific input value affects the model across all customers. These visuals can help end users find inflection points in the range of inputs that the model deems significant.
Even though the non-digital data is not included in our current production model, to support inclusion in the future, the OCR process can be triggered to ingest data as needed. As more data is gathered, it could be useful in the future. ML maturity journeys are not one and done. They are focused on achieving a goal with the data we have now and continuing experimentation with new hypotheses and datasets in the future.
Results / Takeaways
Our original hypothesis that the historical, non-digital data would be crucial alongside the core data set to achieve our goal, was incorrect. However, we were able to achieve our goal solely with the core data set, consistently identifying higher or lower risk of a claim. While the focused customer subgroups were not successful from a modeling perspective, this was a good learning experience for improving non-digital data entry processes.
Business takeaways include:
- A few fields should be available for every customer since they are critically important to the ML model. If not entered by the customer, these data points should be collected and reviewed some other way at more regular intervals. These data points could be valuable, impactful model features in the future.
- Some fields possibly do not need to be captured because they are not helping / not used to determine claim risk.
- In this digital age, it would be easier to just have all customer inputs follow VGM’s digital channel, however, the need to allow customers to provide information non-digitally will continue to be needed to support their mission of Customer First.
- The rate of change on data collection was too rapid to make a consistent data set over time, which is an important consideration as they make revisions going forward.
- The business will be utilizing the initial model for a period before additional tuning or experimentation occurs.
Overall, the hypothesis was proven true and the processor application SPR built to host this model is a success. We were able to incorporate ML predictions of claim risk into an existing business process so the underwriting team can see the score, along with analysis metrics, as they make decisions, ultimately benefiting both VGM and their customers.