Data Science: Back to Basics – It’s about being flexible
Sometimes, we need to be reminded that data science is also an art and there is much more to it than just algorithms. Let’s get “back to basics” today by exploring Yellowstone activity through a variety of models.
Background
A key characteristic of a model is to be specific enough to learn a target function based on its training data, yet flexible enough such that the learned target function provides acceptable performance on unseen observations.
Model Flexibility
A model has to walk a fine line between the specific learning of a concept and its general application. The “flexibility” of a model determines this balance. The flexibility of a model can be described as how much is model’s behavior influenced by characteristics of the data; therefore, the flexibility or inflexibility of a model is a characteristic that should not be overlooked. It can mean the difference between a useful or useless tool.
Multiple regression techniques (linear and polynomial) will be used to demonstrate model flexibility. The data that will be used is the eruption activity at Yellowstone. The variables are the “duration” of a geyser eruption and the “wait time between eruptions”.
Linear Regression
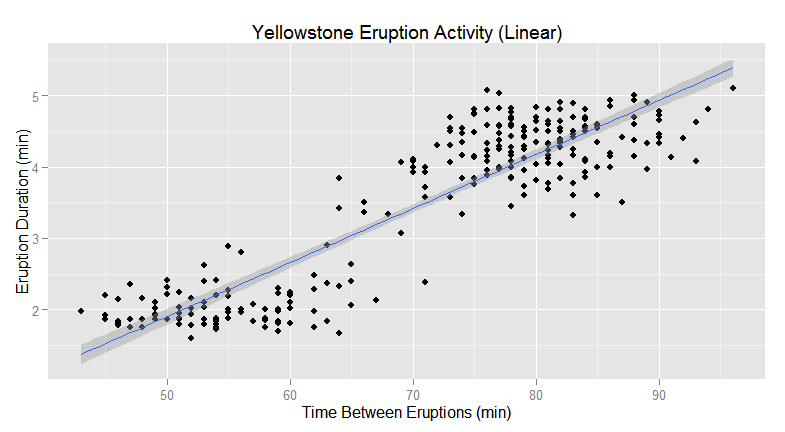
The first model is a linear regression model. Linear regression is considered inflexible because it is biased towards linear relationships among its variables. It is also not heavily influenced by noise in the data; however, extreme outliers may skew the fit of the model.
The following plot depicts a regression line for the eruption activity. Based on observation and measurements, it is known that the eruptions occur on a regular basis. Results from a correlation analysis reveals that the linear regression model (inflexible) appears be a good fit.
Polynomial Regression
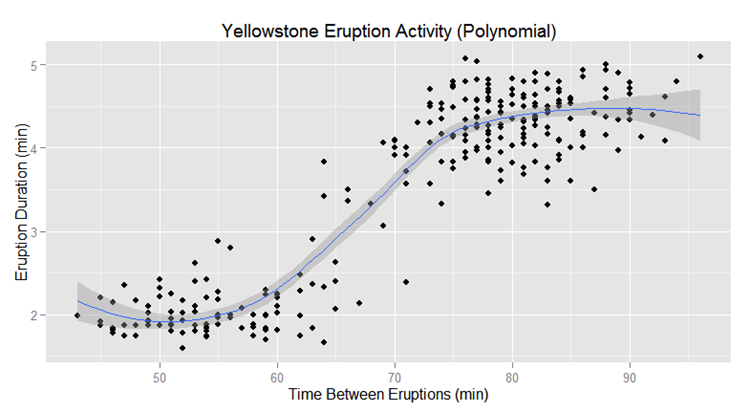
The next example depicts the same data; however, it is using polynomial regression. At first glance, it appears that polynomial regression is a better fit to the data, but polynomial regression is much more flexible than linear regression in that it can detect non-linear relationships. Consequently, it is impacted more by the inherent characteristics of the data and can be more prone to noise.
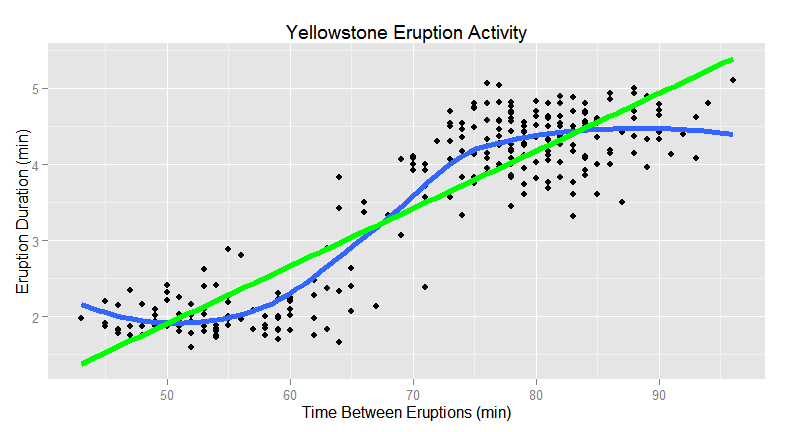
Finally, here is the same data with both the linear and polynomial regression lines overlaid. Now the question becomes, which model represents the true relationship between the variables and provides more accurate predictive results?
To answer this question, inherent domain knowledge and observations should also be considered along with cross validation of the models. For the Yellowstone data, the observation may be that there is a linear relationship between the 2 selected variables. This could potentially override the results obtained from the alternate model. In this case, polynomial regression may provide better predictive results if the increased flexibility does not result in overfitting.
For validation, new observations would be submitted to each model using the time between eruptions to determine which model provides better acceptable results as it relates to the prediction of eruption duration. This leads to the important question of what are acceptable results and what is the tolerance of error as it relates to the defined business requirements?
Clustering
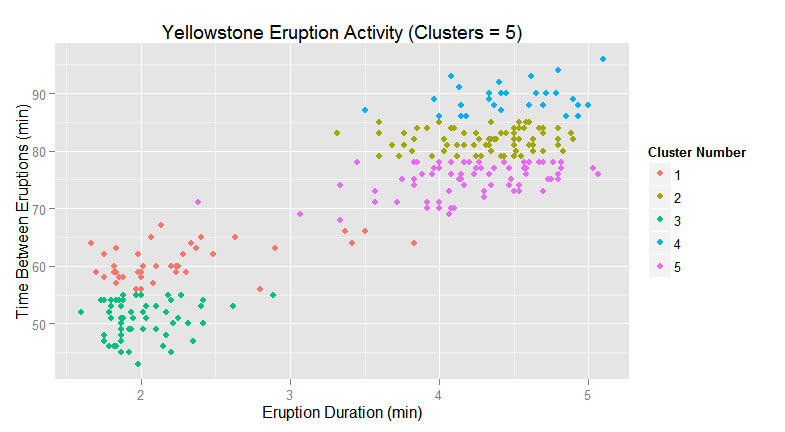
A more extreme example of the impact of model flexibility will be demonstrated with clustering. Using the sample eruption data, there are 2 distinct clusters that can be seen (k-means, k=2) with minimal crossover.
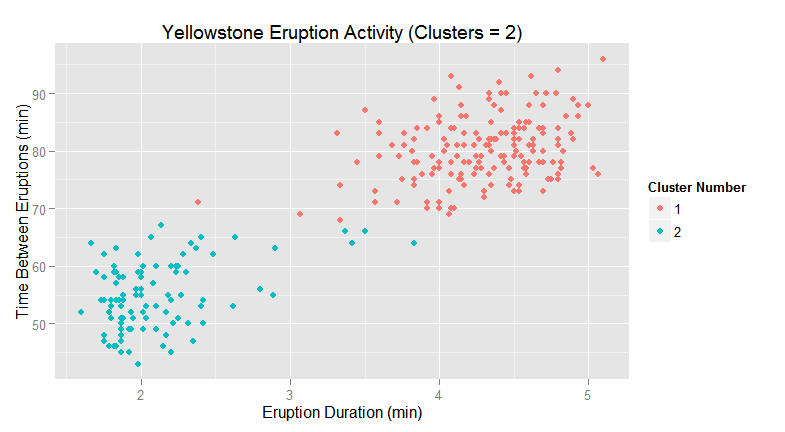
As the number of clusters is increased, the cluster model becomes more flexible. At k=5, the clustering model may begin to identify clusters that are not meaningful or pertinent. This behavior needs to be validated against the defined business problem that is being addressed along with inherent domain knowledge (if available).
Summary
The point of these examples is to demonstrate the impact of flexibility on the performance of the selected model and its predictive capabilities. All models have a degree of flexibility and care needs to be exercised in the selection of a model or when adjusting model parameters.
Here are some general guidelines related to the use of flexible and inflexible models:
Flexible Models
- Good at finding non-linear (complex) behavior
- With large sample sizes, there is less tendency for overfitting however, there is a susceptibility to noise
- There is tendency for reduced bias
- Communicating model behavior may be challenging
Inflexible Models
- Behave better with small sample sizes
- Not as susceptible to noise assuming there are no extreme outliers
- May be good enough based on the requirements of the solution
- Simpler to understand and communicate
I look at this as a refresher to remind us all that data science is also an art and that there is much more to it than just a bunch of algorithms.


