Building a Data Platform from Scratch on AWS – Part 2

This article is the second in a multi-part case study series discussing the data platform my team and I built on AWS for the CIO of a Chicago-based global consultancy. As explained in the first part, one goal for this platform was to centralize data assets and data analysis across the firm using a common architecture, building on top of it to meet the use case needs of each organization. Additionally, business units and consultancy practices had become siloed, each making use of disparate processes and tooling, so in addition to centralizing data assets and data analysis, another goal was to implement the concept of data ownership, enabling the sharing of data across organizations in a secure, consistent manner.
The conceptual architecture comprising data pipelines, data lake, data models, visualizations, and machine learning models is laid out in this previous piece. Alongside this discussion, key guidelines from the CIO are considered, including organization by something called an “insight zone”, as well as industry terms such as bronze, silver, and gold data as these relate to the data pipeline stages built for the platform. Finally, a time-sensitive look at the tech stack selection process is provided, alongside the technologies we ended up implementing for the platform minimum viable product (MVP). So in order to get the most out of this article, it might make sense to read through these discussions first.
Rather than walking through details of the implementation architecture, the goal of this second article is to walk through some architectural discussion points relating to what was implemented for the remaining build effort. These points are presented here in somewhat of a piecemeal fashion, albeit with ties back to the first article, by elaborating on some of the initial architectural decisions that were made, how these decisions held up during the course of the project, and aspects of the build-out one might want to consider as they tackle their own data platform challenges. As before, in order to cater this article to a more diverse audience an attempt has been made here to explain from the context of both data and software development work, as many traditional practitioners in these areas do not have significant experience in both.
The data platform
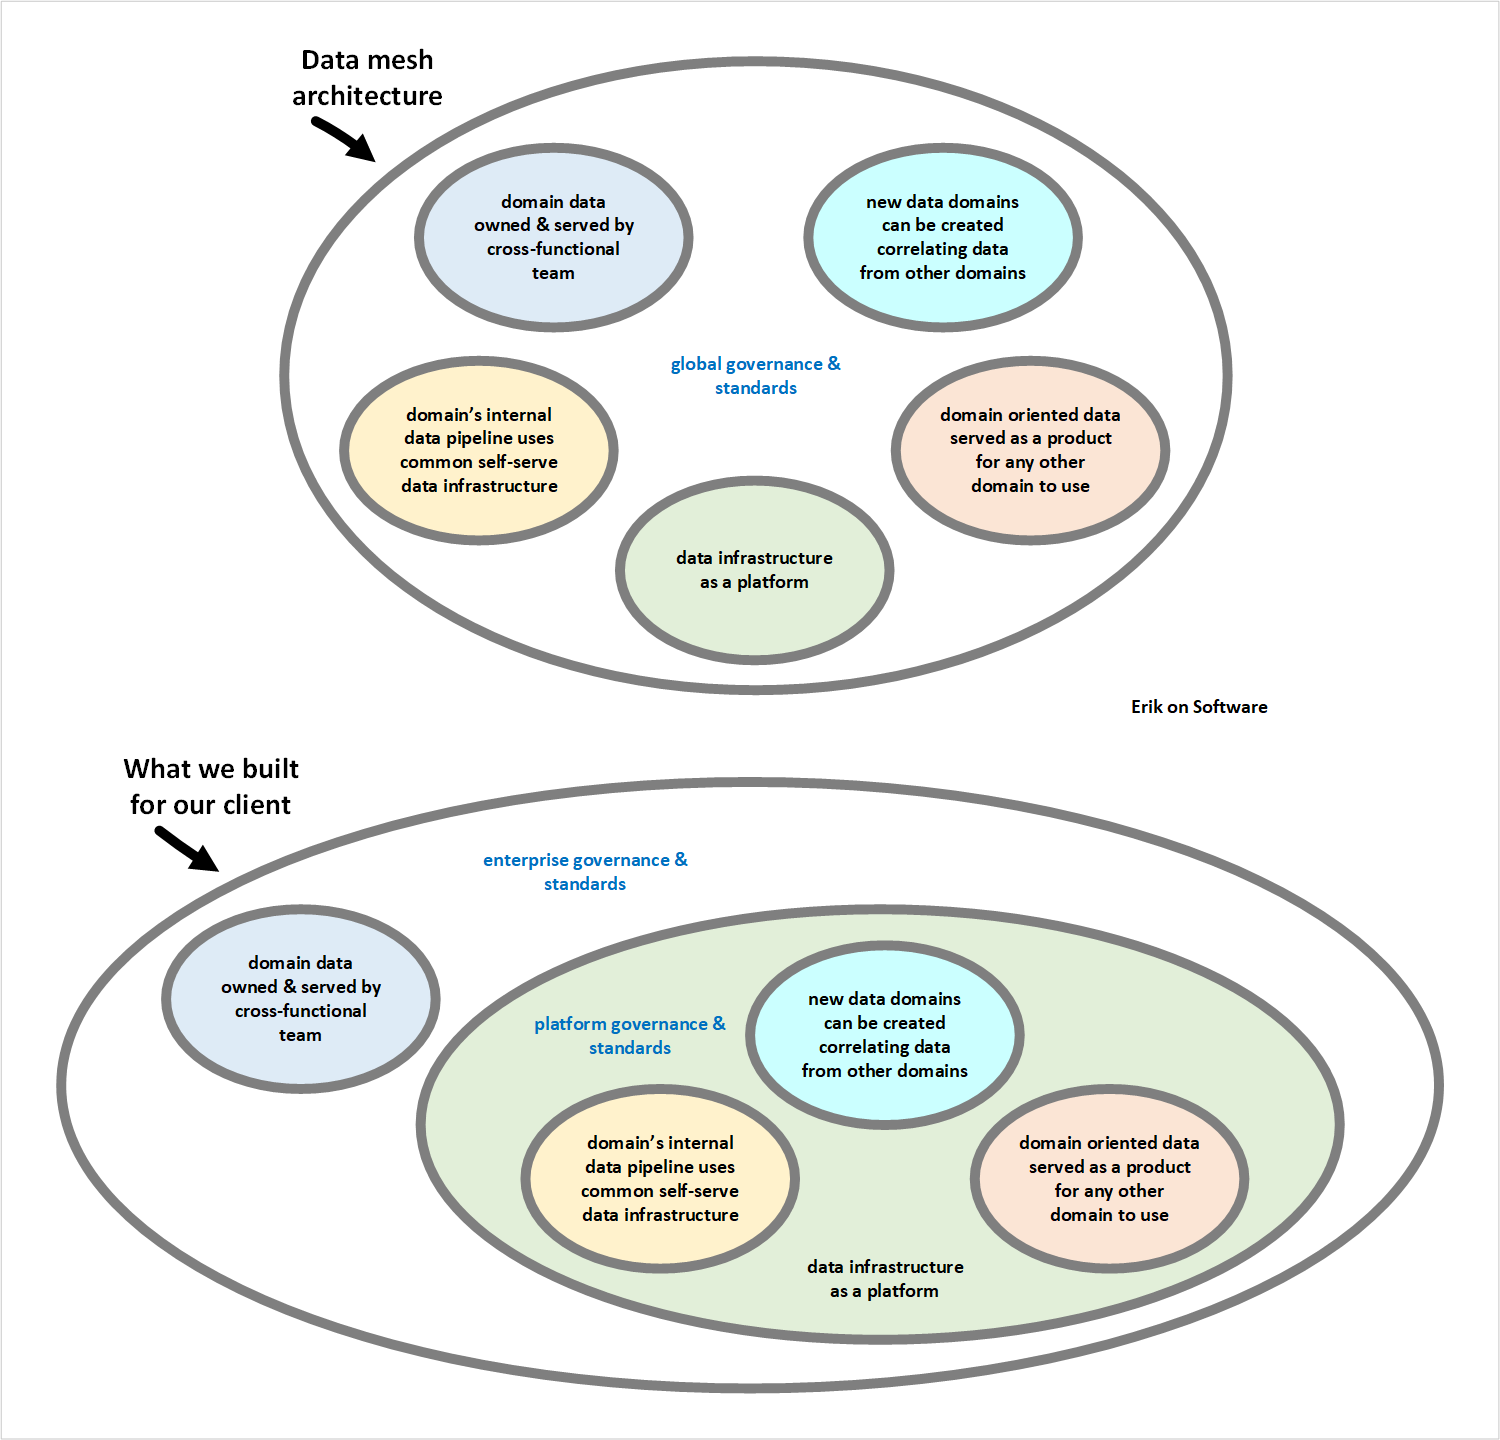
Before moving forward, let’s discuss the “data platform” in the context of other terms such as “data mesh,” and what distinguishes a data platform from an “application platform.” Unfortunately, there exist no universal definitions for these terms, just like many other concepts in technology and business. However, what we didn’t know at the time, martinfowler.com guest author Zhamak Dehghani published an article “How to Move Beyond a Monolithic Data Lake to a Distributed Data Mesh” (May 2019) just after this project started. In the context of this article, what we built was somewhat of a hybrid between a third (current) generation data platform and a fourth generation data platform, summarized by the following table.
| Generation | Characteristics | Notes |
| First |
|
|
| Second |
|
|
| Third (current) |
|
|
| Fourth |
– distributed domain driven architecture
|
|
Other than the decision we made with our client to not focus on real-time data analytics, a comparison between what these two data platform generations provide and what we built would showcase almost every other characteristic was met. One key difference, however, is that we chose to also centralize domain-specific data processing on the “common data infrastructure as a platform” described by the author. To be clear, what we built did not follow the practice of using a “central team of data engineers” for domain data like second generation data platforms. Instead, this infrastructure was laid out using secure, domain-specific insight zones, each owned by independent cross-functional teams and managed by a product backlog.
In contrast, when considering what are commonly referred to as application platforms, one soon finds that the data layer in such solutions is often only considered after the fact, or not at all. And this often proves to be a huge barrier to progress, especially when working with preexisting data, in which case the data layer should be tackled first. Generally speaking, it is typically much easier to rewrite software when needed, whereas with the data layer this is not the case. As mentioned in the first part of this series, one guiding principle we provided to our client is that everything should be versioned. One needs to keep in mind, however, that software can simply be replaced with new versions of code, whereas with the data layer this may not be the case due to the state that is represented by currently stored data.
Methods to address schema evolution exist, but at some downstream consumption point these changes will need to be handled. Application platforms often make use of events in JSON format, for example, and while these permit less stringent data structures through schema-on-read rather than schema-on-write, versioning still needs to be performed for these data structures, as do the APIs created to consume these events. Whereas with application platforms the focus is typically on narrow definitions of output, whether these be for human users or other applications, with data platforms the output can be extremely broad, covering many possibilities because the focus is on the data itself, which will likely serve a variety of use cases.
Platform boundaries
We chose to make use of a central, core team to build and manage the infrastructure along with all the common, configurable components deployed to this infrastructure. Because of this, we needed to define platform boundaries. We knew we needed to determine scope of what was to be considered “on” and “off” the platform, because not only did we expect many sources of data to eventually feed reporting, visualizations, and machine learning models, we were also working within a time box to build the minimum viable product (MVP). As such, we needed to limit team responsibilities in order to release a working platform to production on time, providing governance for a reasonable scope, so we decided that visualizations and processes to send data from source systems to the initial ingress S3 bucket were to be off the platform from the context of the project (the equivalent to the platform at that point in time).
After stakeholders carefully consider platform boundaries over time, these may expand, but there are many aspects to consider, such as the development team resources needed to support the platform. Within the context of this project, however, these boundaries remained the same for the duration of the project. One challenge we had shortly following release of the MVP was that the client decided to quadruple the number of resources working on the platform, during a time period when we were still working to finish implementation of DevOps tooling and processes, and we came to realize that, while well understood platform boundaries existed, the client had no enterprise architecture team to help govern what was off the platform.
Worth noting are two key differences. The first is that a centralized infrastructure is used for everything in the data platform that we built, other than the infrastructure needed to send data from source systems to the initial ingress S3 bucket. The second is that we decided to distinguish between components on and off the data platform, each of which are subject to different governance and standards. While some firms are liberal with respect to how domain teams tackle the serving of data, we recommended that an enterprise architecture team govern what was to be built off the platform. As our client did not have such a team, we recommended that this was a great time to establish one.
As an example of why such a team is important, we discovered that one insight zone development team started using a data tool with which none of us was familiar. This tool also happened to be the free version of a commercial offering, potentially exasperating the issue because use of it may end up leading to additional costs down the road. The development team started using this tool because they claimed the API provided by Salesforce was problematic, not permitting them to ingest data from it using Apache Spark, and that this tool provided resolution to this issue. We immediately realized that if the non-Salesforce tool they began using provided a solution, this tool must be using the API provided by Salesforce under the covers, and so there must be another explanation for the issue.
A demo by the development team showed that while they were getting an error when using the API provided by Salesforce, some of the aggregate data fields they were trying to ingest were the root cause. Since the original data fields at the individual (or disaggregated) level were available and what were needed for the platform, these aggregate data fields could simply be excluded from ingestion. The development team said they could not use it; the business requirements indicated that all fields need to be ingested from certain Salesforce objects. In turn, we reminded them that business requirements sometimes need to be challenged.
At the opposite side of the platform, the business wanted to make use of Microsoft Power BI rather than Amazon QuickSight for visualizations, due to its feature set and their in-house familiarity with it. That said, we discovered that one insight zone development team was performing a significant amount of data modeling within Power BI. As we explained to our client, while products such as Power BI can be used for data virtualization, which consists of locally implemented data models alongside cached source data reflecting different models, doing so tends to set a poor precedent unless solely used for initial POC work.
For example, doing so prevents visibility for a broader audience, does not enable the ad hoc querying of such data from outside the chosen visualization and reporting product, and leads to inconsistency across locally implemented data models for the same tables. We recommended that when client stakeholders make decisions around a visualization and reporting product, make sure configuration of queries and data models can be incrementally versioned alongside the rest of the code base to enable effective DevOps pipelines. This is especially important for any domain data shared with other domains, to help ensure that use of this data is consistent across consumers.
Data stores
While the first part of this case study does not discuss any of the AWS services used for the six different data stages, suffice it to say that half of these use Amazon S3 regardless of the case study that is to make use of the data stored in each of these. That’s because all data arrives as files, intended to progress these files to a state that provides clean, cataloged data. Once a given file is available in the staging S3 bucket, Amazon Athena, can query it, albeit still stored in what is essentially the same record layout as the original raw files. While storing files in each intermediary state consumes more storage, it doesn’t cost much and it permits the ability of insight zones to compare raw files with transformed versions of these files, which together form data lineage.
However, beyond this exploratory usage is the need to execute performant queries, and one of the driving factors in the selection process to choose a data store is performance. A good sense of the data to be stored and the queries to be performed help assess which data stores might best be used. In other words, expected use cases. Now, this does not mean that all details need to be understood at the outset, but this does mean that it will help determine the best direction to take. At the beginning of this project, in contrast, our client had requested that AWS implement a couple common patterns that would handle all of their data, without knowing anything about it, and this request was obviously a nonstarter.
One thing that should be emphasized that was only briefly mentioned at the conclusion of the bronze, silver, and gold data discussion in the first part of this case study is that gold data is not always intended to be used for analytical purposes, even though some vendors seem to imply that this is the case, especially when it comes to machine learning. One insight zone development team, for example, wanted to go straight to an analytical model because they were initially solely focused on specific visualizations and reporting, and skipping the creation of a canonical model for their domain data would have permitted them to close out some of the stories on the board more quickly.
However, what if business users wanted to query data structures, stored with source data granularity, with relatable business terms? What if another insight zone wanted this insight zone to share one or more domain objects? What if other visualizations and reporting needed to be developed for this same data?
As one of the only two client guidelines stated preference to make use of native AWS services, it does not take long to realize that we were essentially limited to three data store options, because none of the others made sense: Amazon S3 + Amazon Athena (Presto), Amazon Aurora, and Amazon Redshift. While there were many factors we took into account, the following table is a simplified version of the scenarios in which we indicated each should be used for this client.
| AWS Service | When to Use for Analytical Store? | Notes |
| Amazon S3 + Amazon Athena (Presto) |
|
|
| Amazon Aurora |
| |
| Amazon Redshift |
|
|
Of these options, note that this first option is not technically a database because Athena queries can be executed against data where it is already stored in S3. In other words, the data does not need to be first loaded into another product. However, Athena needs to be told what this data looks like in order to interpret it. In addition, keep in mind that Athena makes use of open source Presto under the covers, making it a distributed product. Redshift is also a distributed product, but since Redshift involves a load step the distribution style can be chosen after the fact. When using Athena, data needs to be preemptively stored as needed by queries. However, while both of these products have nodes, these are largely transparent to the Athena user. Aurora also has nodes, but processing is not distributed.
AWS Glue, AWS Lake Formation, and Databricks
Of all the tooling we considered and ended up implementing for this client, perhaps the greatest discussions are to be had about AWS Glue, AWS Lake Formation, and Databricks, since the functionality of these overlap with one another, and these are moving along the fastest. Of these three, AWS Lake Formation is the least mature, trailing AWS Glue by a couple years, with Databricks looking back at these products from a distance. As discussed in the first part of this case study, Databricks Unified Analytics Platform was not adopted for a number of reasons, including the facts that it is not a native AWS service, and AWS plans to increasingly roll out overlapping features over time, but that it may make sense to include Databricks products at a later point. Let’s take a closer look at this timeline.
| Date | Event | Notes |
| August 2017 | AWS makes Glue generally available (GA) | |
| December 2017 | Apache Spark 2.2.1 released | |
| April 2019 | Our client project starts | |
| April 2019 | Databricks open sources Delta Lake (version 0.1.0) | Delta Lake 0.1.0 requires Apache Spark 2.4.x |
| May 2019 | Apache Spark 2.4.3 released | |
| June 2019 | Databricks adds support for Apache Spark 2.4.3 | |
| July 2019 | AWS adds Glue support for Apache Spark 2.4.3 and Python 3 | AWS Glue prior support solely for Apache Spark 2.2.1 and Python 2.7 (we subsequently standardized on Python 3.6 for AWS Lambda functions, Glue Python shell scripts, Glue Spark jobs, and Glue Development endpoint SageMaker notebooks) |
| August 2019 | AWS makes Lake Formation generally available (GA) | AWS warned us not to use Lake Formation for production, either prior to this milestone, or for an unspecified period of time post-GA, due to expected instability |
| September 2019 | Our data platform MVP was released to production | |
| October 2019 | Our meeting with Glue & Lake Formation product manager | AWS presented to us the Glue & Lake Formation roadmap for 4Q2019 through 3Q2020 (under NDA) that was broken down into using, administering, and building data lakes, as well as data lake infrastructure |
| October 2019 | Our project team resources working on data platform quadruple | |
| October 2019 | Our data platform core team focus shifts to resolving technical debt and completing DevOps for use by expanded team | |
| January 2020 | Planned desupport of Python 2.7 by Python Software Foundation… | |
| February 2020 | Our client project ends | |
| April 2020 | …J/K, Python Software Foundation decided to delay desupport of Python 2.7 three more months | |
| April 2020 | AWS adds Glue support for Spark Structured Streaming | One of the Glue features I had especially been waiting for, even though our focus on this project was not real-time data analytics (I’ve since tested this feature with Amazon Kinesis Data Streams, and requested that AWS update the Glue pricing page to include this third Glue option) |
| June 2020 | Apache Spark 3.0.0 released | |
| June 2020 | Delta Lake 0.7.0 released | Delta Lake 0.7.0 and above requires Apache Spark 3.0.0 (note the existence of relatively immature Delta Lake competitors Apache Hudi and Apache Iceberg, with Apache Hudi officially supported by Amazon EMR, possibly predicting subsequent support by Glue) |
| June 2020 | Databricks adds support for Apache Spark 3.0.0 |
We explained during our final knowledge transfer sessions to our client in 1Q2020 that architects will need to keep up with AWS Glue releases, Apache Spark releases, and any other releases of supporting products, including key open source libraries being used, as the client continues to build out its product backlog for the data platform. While this case study cannot go into detail about the Glue and Lake Formation roadmap that AWS presented to us during this project, since it is under NDA, it is especially important for client architects to keep up with new features released for these products.