Earned Value, Velocity, & Predictability in Software Development

Perhaps one of the least well-understood concepts in agile project management is velocity. Sure, it’s pretty much what it sounds like – the speed at which the team is moving – but having just that high level understanding of velocity undercuts its value and power in bringing predictability to a project.
Be forewarned that this post is going to be a bit of a long and winding read. I’m going to take a brief trip back in time, to when waterfall methodology was the norm, long before we conceptually broke software projects down into cohesive units of delivered business functionality (user stories).
Of course, the need to estimate effort and track progress did not begin with the advent of agile methods. Our track record in accurate estimation of software development projects has been pretty dismal over the years – but there have been individuals and organizations who have done it quite well. And – not surprisingly – the techniques that were effective then bear striking similarities to agile concepts like story points and velocity. So, as in the spirit of standing on the shoulders of the giants who have come before us, let’s take a quick look at something called earned value.
Earned Value
Simply put, earned value is a measure of completed work. If you set out in the morning to set 100 fence posts in the ground, and by noon you have 60 of them standing, you have an earned value of 60 set fence posts. On the flip side of the coin, you have an “estimate to complete” of 40 fence posts. Simple. Straightforward.
But we all know that software development is not so simple and straightforward. Tasks are far more nebulous than setting fence posts, and vary wildly in size and complexity. So, historically, we have estimated software development work at the granularity of some sort of task (ideally, one that is small enough to conceive pretty fully when estimating), using estimated hours of effort as our measuring stick.
Let’s say we are writing a simple Set class in a brand new programming language, and have the following tasks identified:
- Create data structure and default constructor – 2 hours
- Implement ‘add’ method (including protection against duplicate members) – 4 hours
- Implement ‘remove’ method – 1 hour
- Implement ‘contains’ method – 1 hour
- Implement ‘clone’ method – 3 hours
From this list of task level estimates, we arrive at an overall estimate of 11 hours to build the class.
Now, let’s say we roll up our sleeves, fire up the IDE, and complete the first two tasks. We now have a bare bones Set class, with an appropriate internal data structure and the ability to add objects to it. Let’s further assume that it took us 4 hours to complete that work. With this information, we know the following regarding the completed work:
- Estimated effort: 6 hours (2 plus 4)
- Actual effort: 4 hours
- Earned value: 6 hours
But wait. We earned 6 hours? But we only worked 4. That’s right. What we do in earned value analysis is use an hour of estimate as a sort of currency for measuring progress. If we believe a task would take 6 hours, its value is 6 hours – and when it’s complete, we earn all that value – whether we ‘burned’ (spent) it or not. (This technique is sometimes referred to as ‘earned vs burned’ analysis).
On large projects that take place over months or years and involve many people, it is the aggregation of these simple calculations that is so valuable. For as we collect more and more data of this sort, the law of large numbers tells us that we can start to trust an emerging trend. Any single task may have been over- or under-estimated, perhaps grossly – but when hundreds of tasks are completed and we gather this data, we can be pretty sure that our efficiency – the ratio of hours burned versus hours earned – will remain pretty constant.
In order to identify and analyze trends, charts are effective tools. So project teams often use a burn-up chart like the one below, which map several important measurements over time:
- the number of hours the team had planned to work
- the number of hours the team actually worked
- the number of hours the team earned (by completing tasks)
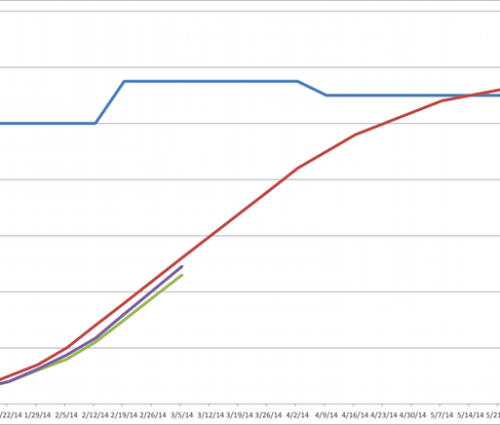
There is a natural slope to these values when mapped over time, as you can see in the example. They start at zero, and climb steadily toward an intersection point with another line – one that represents the total scope of the project (sum of all estimated tasks) – at which point the project is complete.
In the example, I’ve shown how that top line – total estimated effort – can change over time, representing work being added to or removed from project scope.
As a project progresses, the actual and earned lines continue their emergence, onward and upward, until that magical day when the line really does intersect with the project scope line, and the project team gets to go to Disney World.
The power of a chart like this lies in its predictive capabilities. In our example, the actual effort line lags below planned effort, because the team didn’t spend as many hours on the project as we expected it to in the early going (presumably, the team was short-handed). Unless we increase the allocation of human capital to the team going forward, we’ll never make this up.
However, there is good news. The team is earning value at a higher rate than it is expending effort – which is to say, it’s beating estimates on most of its development tasks. Even more telling is the slope of the earned value line – it is increasing more rapidly than the actual effort line – meaning that this unexpected efficiency wasn’t a one time event, but seems to be pretty consistent (each “win” in terms of finishing work below schedule will increase the distance between the actual and earned lines). So while it’s pretty early to be celebrating, it does look like this team is “on pace” to finish the project below estimated effort (and, therefore, below budgeted cost) – though becase of the slow start in staffing, it may not finish ahead of schedule).
Story Points and Velocity
So, what does all this earned value stuff have to do with modern agile measurements like story points and velocity? Quite a lot, actually.
With the advent of agile, most teams no longer estimate in terms of tasks and hours. They do it in user stories and story points.
While there are many characteristics of a user story that distinguish it from a mere task, from an estimating and measurement perspective, tasks and stories are nearly indistinguishable – both are a fixed, well-defined unit of software development work, to which we can fairly reliably ascribe some level of difficulty / complexity / effort.
The unit of estimation is the other key difference. Not hours – story points. Abstract valuations of the relative size and/or complexity of a story, as compared to its peers in our project’s backlog. You’ll read over and over again in the literature that a story point is not(!) a representation of time, or of effort – merely one of scope or complexity. It bears relation to effort only through another agile measure – velocity.
Velocity is a measure, usually expressed as an average, of the number of story points a team completes (earns!) in a given sprint. If a team completes three stories in a sprint – with assigned story points of 1, 3 and 8, the team’s velocity for that sprint is 12.
So that’s how velocity is calculated. But what does it mean? Why do we bother calculating it every sprint?
Because velocity helps us predict the future, just like earned value does. In fact, in rough terms, velocity is a numerical representation of the slope of the progress lines on the chart we examined in our look at earned value.
There are actually two types of velocity – planned (or, if you prefer, estimated) velocity, and actual velocity. At the outset of a project, it’s a worthwhile exercise to make some prediction of how “fast” the team will go. And that predicted speed is likely to change over the course of the project, as the team size (typically) grows during its “ramp-up” period, and then decreases in size as the project nears completion. Using a model of planned velocity, and knowing the total number of story points in the backlog, project managers can formulate a model for answering those ultimate questions – when do we think we’ll be done, and how much is it going to cost?
Of course, any answers generated by such a model before we start measuring actual progress are likely to be wildly inaccurate. But as we begin work, and measure our actual velocity at the end of every sprint, we can see how the team is performing in comparison with our initial predictions (just as we compared earned value to plan, over time). The farther we get into a project, the more reliable the trend lines. If the team has had an actual velocity of 15 points for the last 4 sprints, it’s pretty likely to keep going at that pace (assuming we don’t add or remove any team members) – even if we initially *thought* that the team would be earning 20 points per sprint.
An agile burn-down chart, which can be generated manually, or automatically in most agile project management tools, is essentially the same animal as an earned-vs-burned effort chart – it’s a tool for helping all of the project stakeholders understand not only “where we are” on a project, but where we’re likely to be in 2, 3 or 10 sprints.
Before concluding, I’ll reiterate that story points are not in any way related to a unit of effort. You’ll see that point made – clearly and sometimes vehemently – in most of the agile literature out there. And I’m not suggesting here that it is. As I mentioned above, story points are related to effort only through velocity (whether anticipated or measured). That, however, is not the primary point of this post. My point is that in today’s software development world, as well as project management techniques used before the Great Agile Upheaval, the key to a team’s ability to predict future outcomes is best served by accurately measuring the present, and aggregating those measurements with its recent past – and capturing trends. For whether it’s the slope of the ‘earned’ line, or average measured velocity, you can’t find a better predictor of near-term future performance than near-term past performance.