Integrating Power BI and Python

For those who don’t know, Power BI has the ability to integrate with other platforms used to develop advanced analytic solutions, specifically, “R” and “Python”. In this post, I will present a simple example illustrating the integration of Power BI and Python with an additional goal of getting the reader thinking about other ways of leveraging Power BI and Python.
Background
The first question is why would you use Python with Power BI? Well, Power BI provides access to a large number of data visualization and data blending capabilities. Python’s data engineering features and frameworks extend Power BI capabilities and also provide capabilities that are not available in Power BI.
Configuration
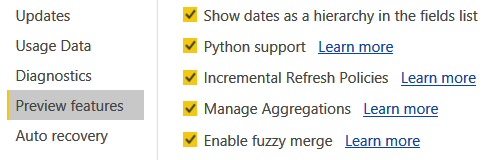
To get started you need a Python distribution installed and install packages you wish to use. I am using Anaconda Python. Turn on the Python Support under Power BI preview features (File -> Options and Settings -> Options -> Preview features -> Python Support).
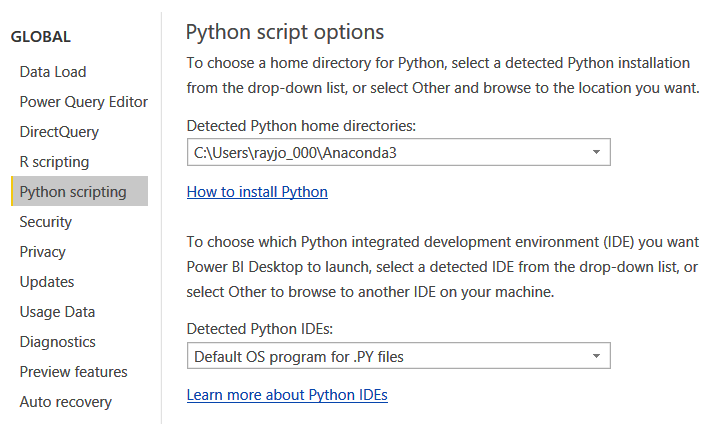
Finally, point Power BI to the instance of Python you are using. At this time you can also set up an external IDE to link to. The external IDE is definitely a personal preference and is sometimes the cause of intense debate (subject for a future post).
Now, we are ready to use Python with Power BI. Python is used for two tasks in Power BI: to import and manipulate data, and to produce data visualizations.
Loading Data
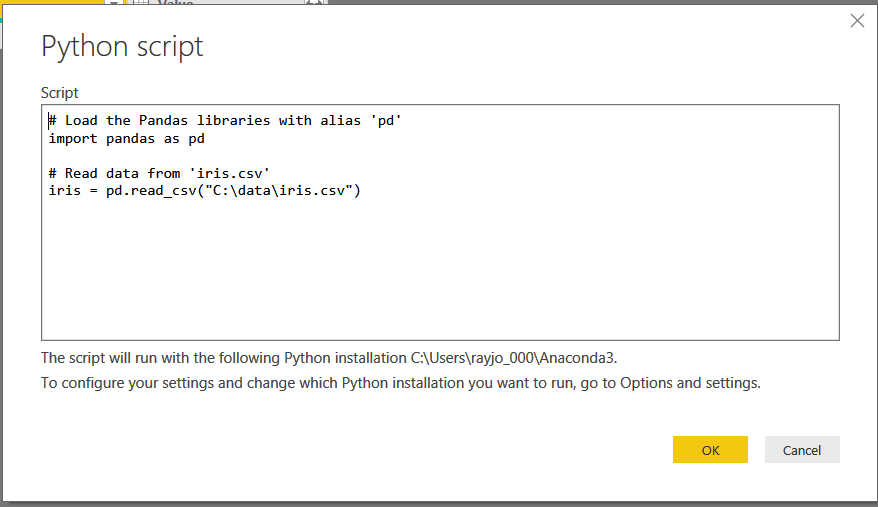
Importing data into Power BI is fairly simple. In Power BI select Home -> Get Data -> Other -> Python script. The Python scripting window opens and you can enter your code. I will import the ever popular iris dataset formatted as a CSV file with headers.
After you click OK, close the query window and the data will be loaded. The key point here is that you have all of the power of Python at your disposal to perform data engineering tasks as well as Power BI’s query editor. Following is a Power BI report showing the loaded data.
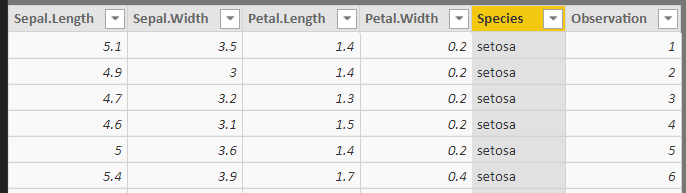
Sample of loaded Iris data
Data Visualization
For the data visualization I am going to display a correlation plot and a box plot. The box plot will be based on the Sepal.Length. To create the visualization, place a Python Visual on the canvas.
The Python script editor will be displayed. Select the fields to include in the visual. Power BI will create the necessary code stub to make Power BI data available as a dataset inside of the visual. Import any additional libraries and write the required code to produce the visualization. The results of your Python code must produce a visualization or an exception will occur.
Here is the code for the correlation plot visual:
#############################################
# Import require modules
import seaborn as sns
import matplotlib.pyplot as plt
# Create correlation plot
sns.pairplot(dataset, hue = “Species”)
plt.show()
#############################################
Here is the code for the box plot visual:
#############################################
# Import required libraries
import seaborn as sns
import matplotlib.pyplot as plt
# Define plot aesthetics
sns.set_style(“darkgrid”)
sns.set_context(“notebook”, font_scale=1.2)
# Create box plot
sns.boxplot(data=dataset, x=”Species”, y = “Petal.Length”, hue=”Species” )
plt.show()
##############################################
Results
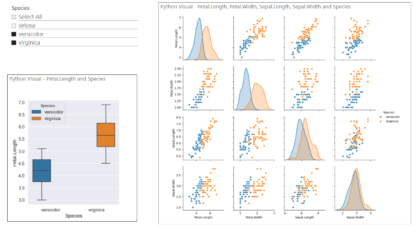
In the final result, a slicer has also been placed on the canvas. The slicer will interact with the Python visuals to provide filtering. Below is the completed report. Species is being used as a slicer and only versicolor and virginica have been selected. This is reflected in the Python visuals.
Summary
This is a simple example of what can be done when Python is integrated with Power BI. Controls from the Power BI marketplace could have been used to build the example; however, it is the increase in overall capabilities and flexibility provided via this integration, which allows the development more complex data engineering and advanced analytic solutions.